![]()
![]()
SapphireIMS supports custom log monitoring which allows collection of log data from any kind of source including applications. Refer to Settings->Fault and Notifications->Application Log for details on setting up the log monitor and the fields which are displayed.
From the top menu bar in SapphireIMS, point on 'Fault' and click 'Application Log'. The Application Log Dashboard is displayed.
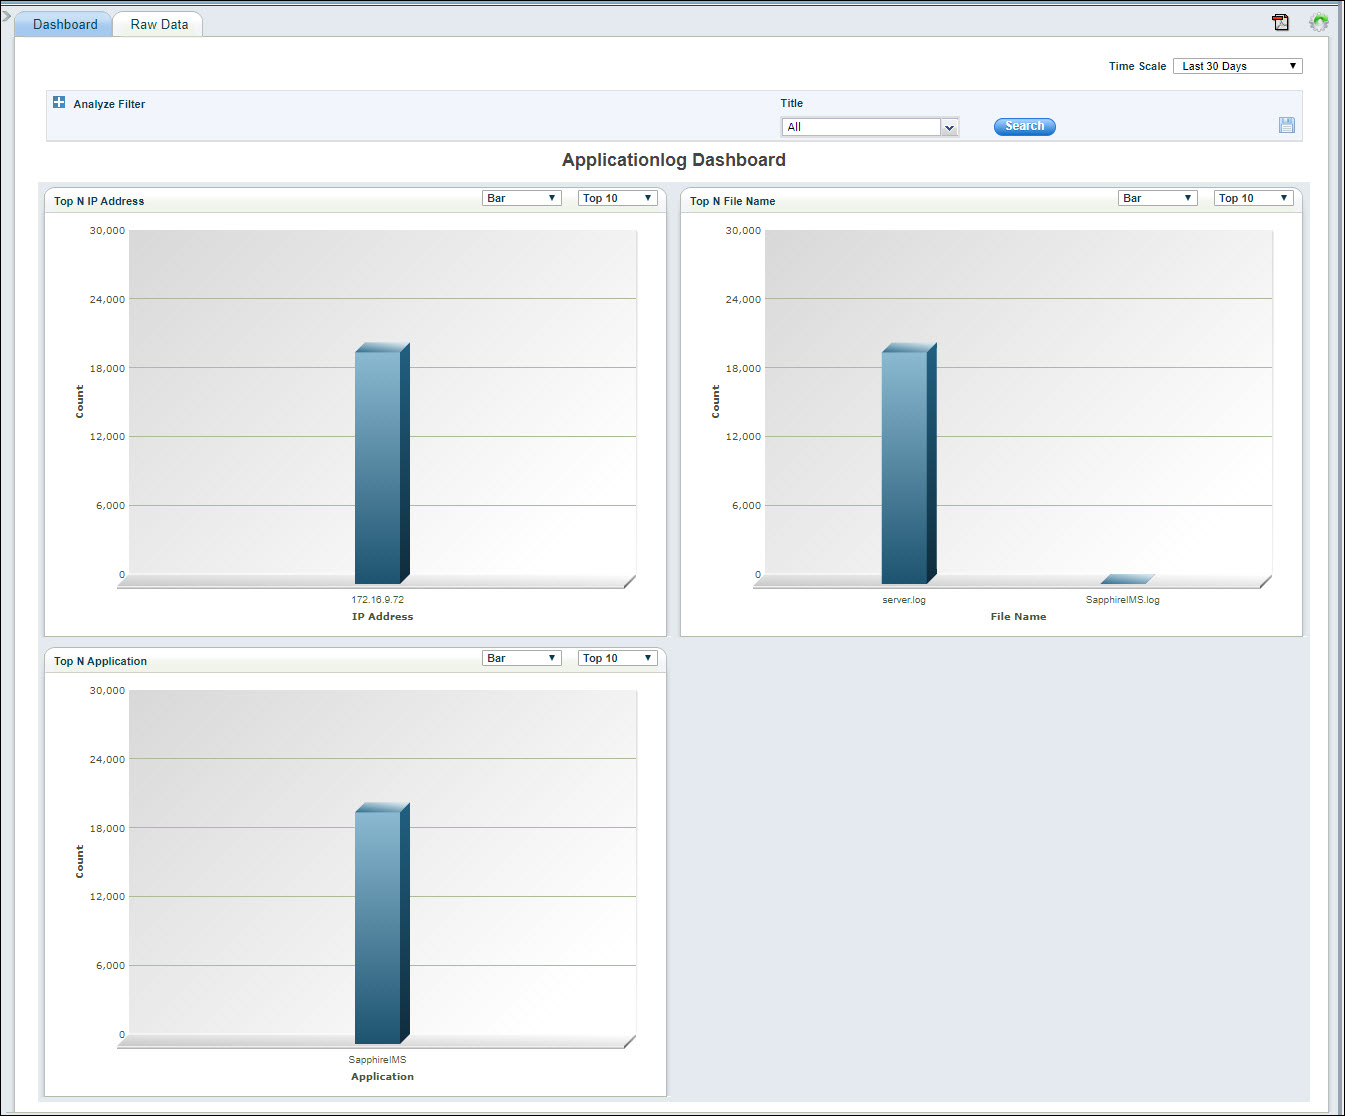
The following dashboards are displayed:
Top N IP Address: Displays the top N distribution of Application logs from different hosts.
Top N File Name: Displays the top N distribution of Application logs from different Files.
Top N Application: Displays the top N distribution of Application logs from different applications.
Click on  and
select from among the 'Top N' or 'Bottom N' data in the drop-down
list.
and
select from among the 'Top N' or 'Bottom N' data in the drop-down
list.
Click on  and
select from among the chart types in the drop-down list.
and
select from among the chart types in the drop-down list.
Click on  to select
the time scale for the dashboard.
to select
the time scale for the dashboard.
Refer to section Changing the refresh interval if you want to enable auto-refresh and change the refresh interval.
Refer to section Setting up Analysis Filters to filter the data.
Once the filter rules are setup,
to save the search profile, click on  . A pop-up
is displayed to enter the profile details
. A pop-up
is displayed to enter the profile details
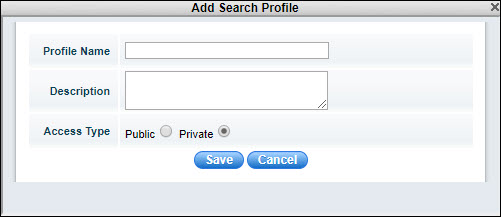
Enter the 'Profile Name' and 'Description'. To publish this profile select 'Public' else select 'Private'.
Click on 'Save'. A confirmation is displayed that the profile is saved. Click on 'OK'.
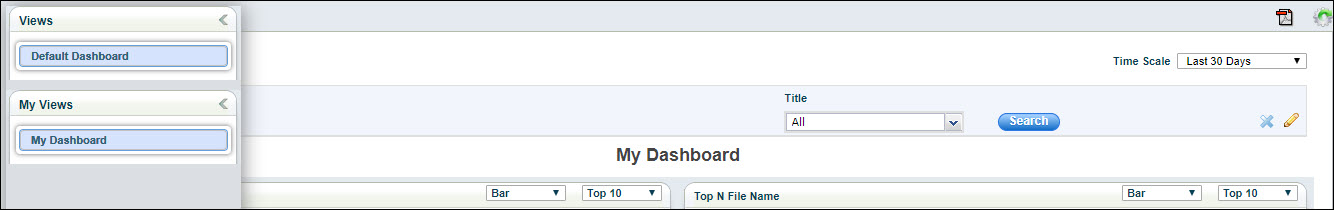
Once the profile is saved, it can be selected from the left hand menu which slides out when the arrow is clicked. The dashboard is updated based on the selected profile. Both 'Views' which are public and 'My Views' which are private are listed here.
To edit the profile click on  and to delete the profile click on
  .
.
The Raw Data for the Event Log can also be viewed as a listing.
Click on the 'Raw Data' tab.
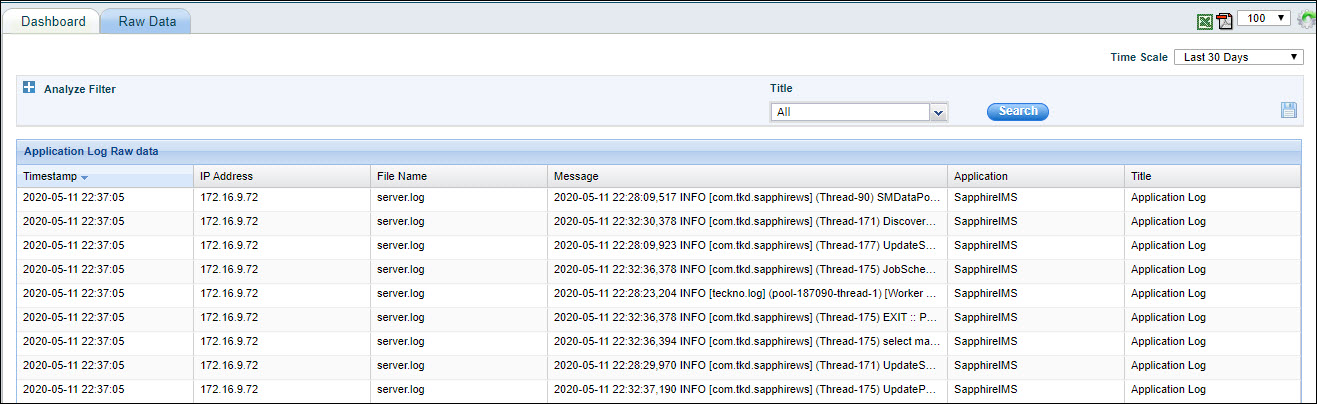
The event log listing is displayed.
Use the Filter Analysis as detailed under Setting up Analysis Filters section to filter the raw data.
The views can be changed by selecting
the fields. Click on . The
search profile entry screen pops-up.
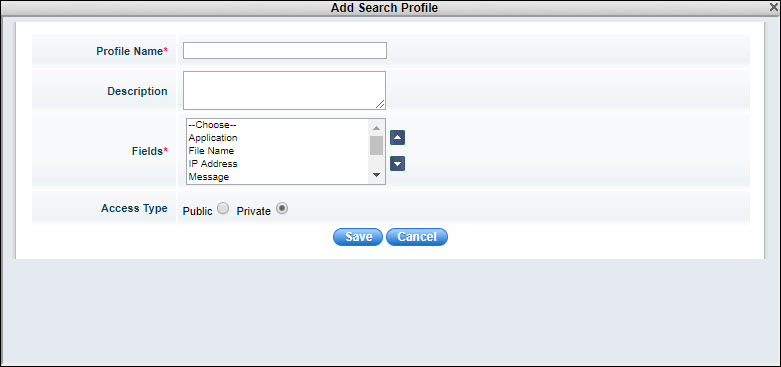
Enter the 'Profile Name' and 'Description' for the profile.
Select the 'Fields' which should be displayed in the columns.
Select the 'Access Type' as 'Public' to make it available for all or 'Private'.
Click on 'Save' to create a new profile or 'Update' to update the profile.
To save the summary table in a PDF, refer the section Saving Views and Reports as a PDF file.
To export the data in an excel, refer the section Exporting Views and Reports into an Excel file.
Filters can be set to analyze the data displayed for dashboards and summary views. These filters could incorporate rules based on parameter values.
Click on 'Analyze Filter'. The Analysis Filter expands as shown below.
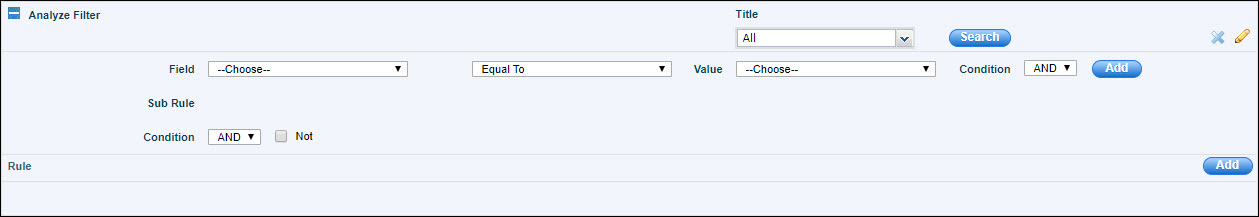
Select the 'Title' to filter on.
You can create filter rules based on field values and combine multiple sub-rule into a single rule.
Click on 'Search'
after adding the rule. The data is filtered based on the rules and
displayed. To save the filter rules, click on ,
enter the profile details and save.
Click on  to select
the auto refresh interval. The refresh entry details screen pops-up.
to select
the auto refresh interval. The refresh entry details screen pops-up.
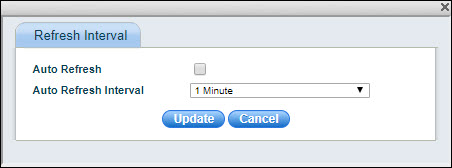
Select 'Auto Refresh' if you want the dashboard to be automatically refreshed. Select the 'Auto Refresh Interval' and clock on 'Update'.
To save the dashboard in a PDF, refer section Saving Views and Reports as a PDF file.
To save the dashboard in a PDF file,
click on  . A pop-up to enter the PDF options is
displayed.
. A pop-up to enter the PDF options is
displayed.
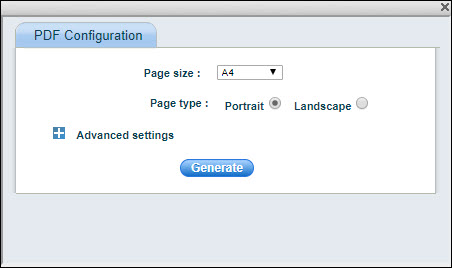
Select the 'Page Size' and 'Page type'. Click on 'Advanced' to select other options.
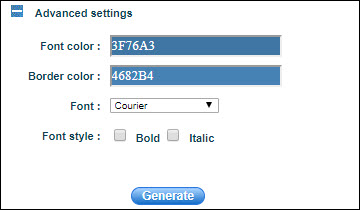
Select the 'Font Color', 'Border Color', 'Font' and 'Font style'. Click on 'Generate' to generate the PDF file.
Any view or report can be exported
into an Excel file. Click on ![]() .
.
An excel file is created with the name as the label on top of the table in the summary or raw data views.