![]()
![]()
SapphireIMS has a number of in-built dashboard widgets using which the dashboard can be configured. While the Dashboard is accessible from the Service Desk module, it has widgets for other modules as well. Appropriate widgets can be selected such that the dashboard gives a complete view across all IT functionality including Service Desk, Asset Management, Inventory and Automation and Monitoring.
Custom role based dashboards can also be created with new widgets. This topic provides the details on creating new widgets.
Click on  on the Dashboard Customization screen
to add a widget or click on
on the Dashboard Customization screen
to add a widget or click on  on the widget to edit the widget. The Widget Builder screen is displayed.
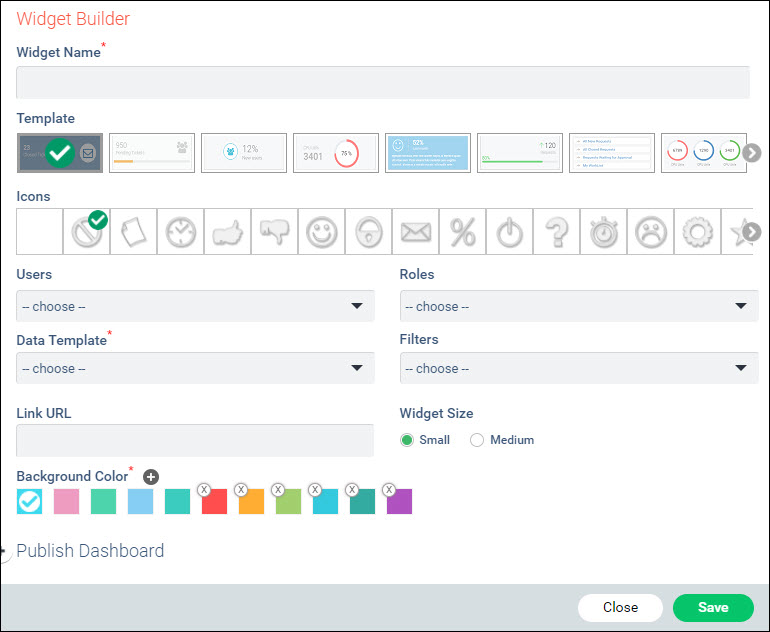
The fields are described in the table below.
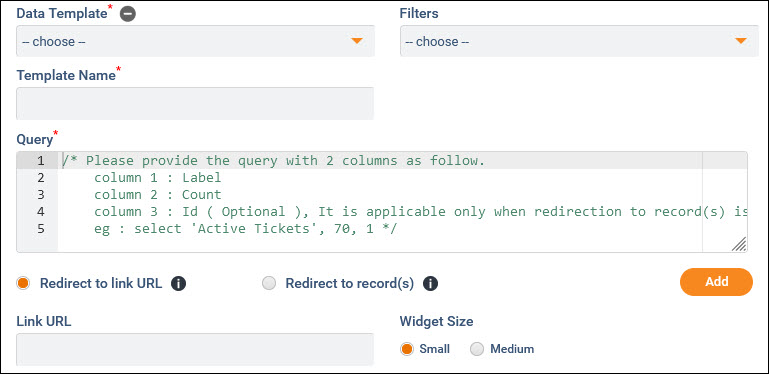
 Note: Wherever queries need
to be configured, please contact SapphireIMS Support to obtain the queries
since it needs internal product knowledge.
Note: Wherever queries need
to be configured, please contact SapphireIMS Support to obtain the queries
since it needs internal product knowledge.
|
After entering all the fields click on 'Save'.
The purpose of these Widget types is to navigate to any part of the Service Desk quickly. The widget addition screen is shown below.
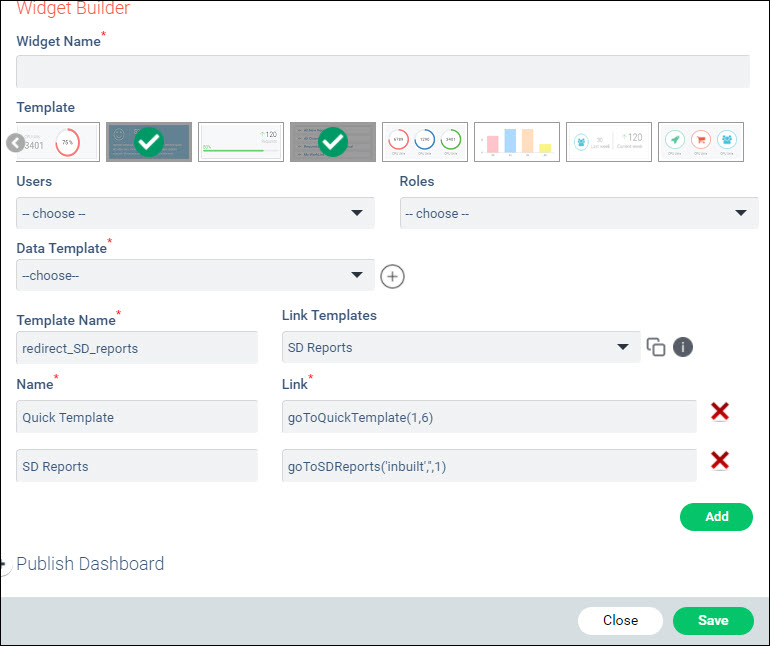
The initial fields are the same as for any other widget.
Click on  next to the
Data Template selection.
next to the
Data Template selection.
Enter the 'Template Name'.
From the 'Link Templates' list, select the Template to use.
Enter the 'Name' of the link.
Click on  next to the 'Link
Templates' field to copy the link.
next to the 'Link
Templates' field to copy the link.
Paste the link in the box 'Link'
by typing CTRL+V. Hover on the  icon
to get the macros to be replaced with the actual values. For example,
'goToQuickTemplate(MACRO_QUICKTEMPLATEID,MACRO_PROJECTID)'
is the link which is created. On replacing the macros it could look
like 'goToQuickTemplate(1,6)'
where the Quick Template ID is 1 and the Project ID is 6. You can
contact SapphireIMS Support for getting these IDs.
icon
to get the macros to be replaced with the actual values. For example,
'goToQuickTemplate(MACRO_QUICKTEMPLATEID,MACRO_PROJECTID)'
is the link which is created. On replacing the macros it could look
like 'goToQuickTemplate(1,6)'
where the Quick Template ID is 1 and the Project ID is 6. You can
contact SapphireIMS Support for getting these IDs.
In the case of Quick View widget, instead of links, icons can be configured to select any link for redirection.
 and
up arrow
and
up arrow  and which can be red or green colors.