![]()
![]()
Enterprise View provides a consolidated view of all the devices configured for performance monitoring under 'Business Service Monitoring' under 'Settings'.
On the SapphireIMS menu, point to ‘Performance’ and click on 'Enterprise’. The List View is displayed as shown in the screen below.
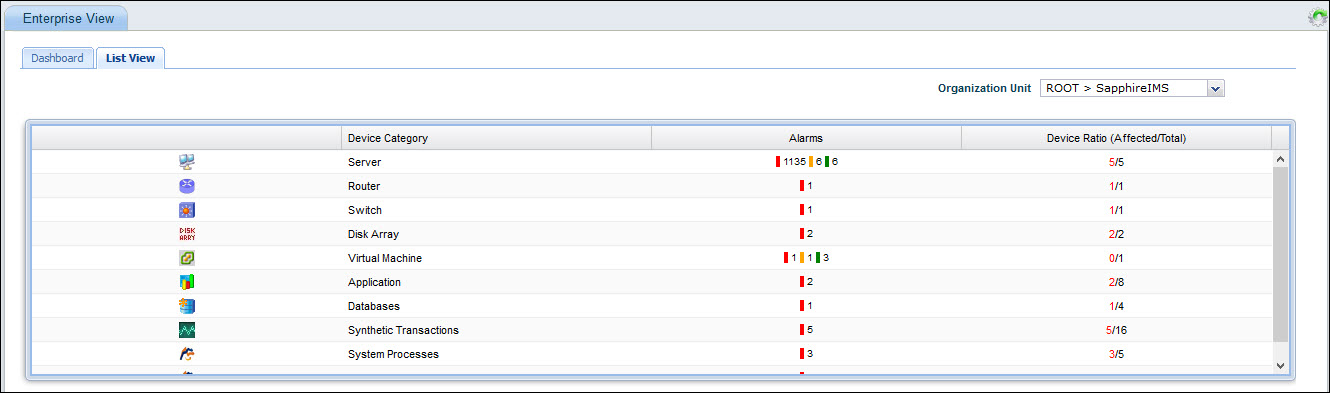
The split of alarms as Info, Warning and Critical is displayed along with the counts. Clicking on any alarm indicator, causes the Alarm List View to be displayed in a pop-up containing the alarm details.
The Device Ratio gives the ratio of the Affected systems to the Total systems.
Click on a device/category to view the details of the monitored entity.
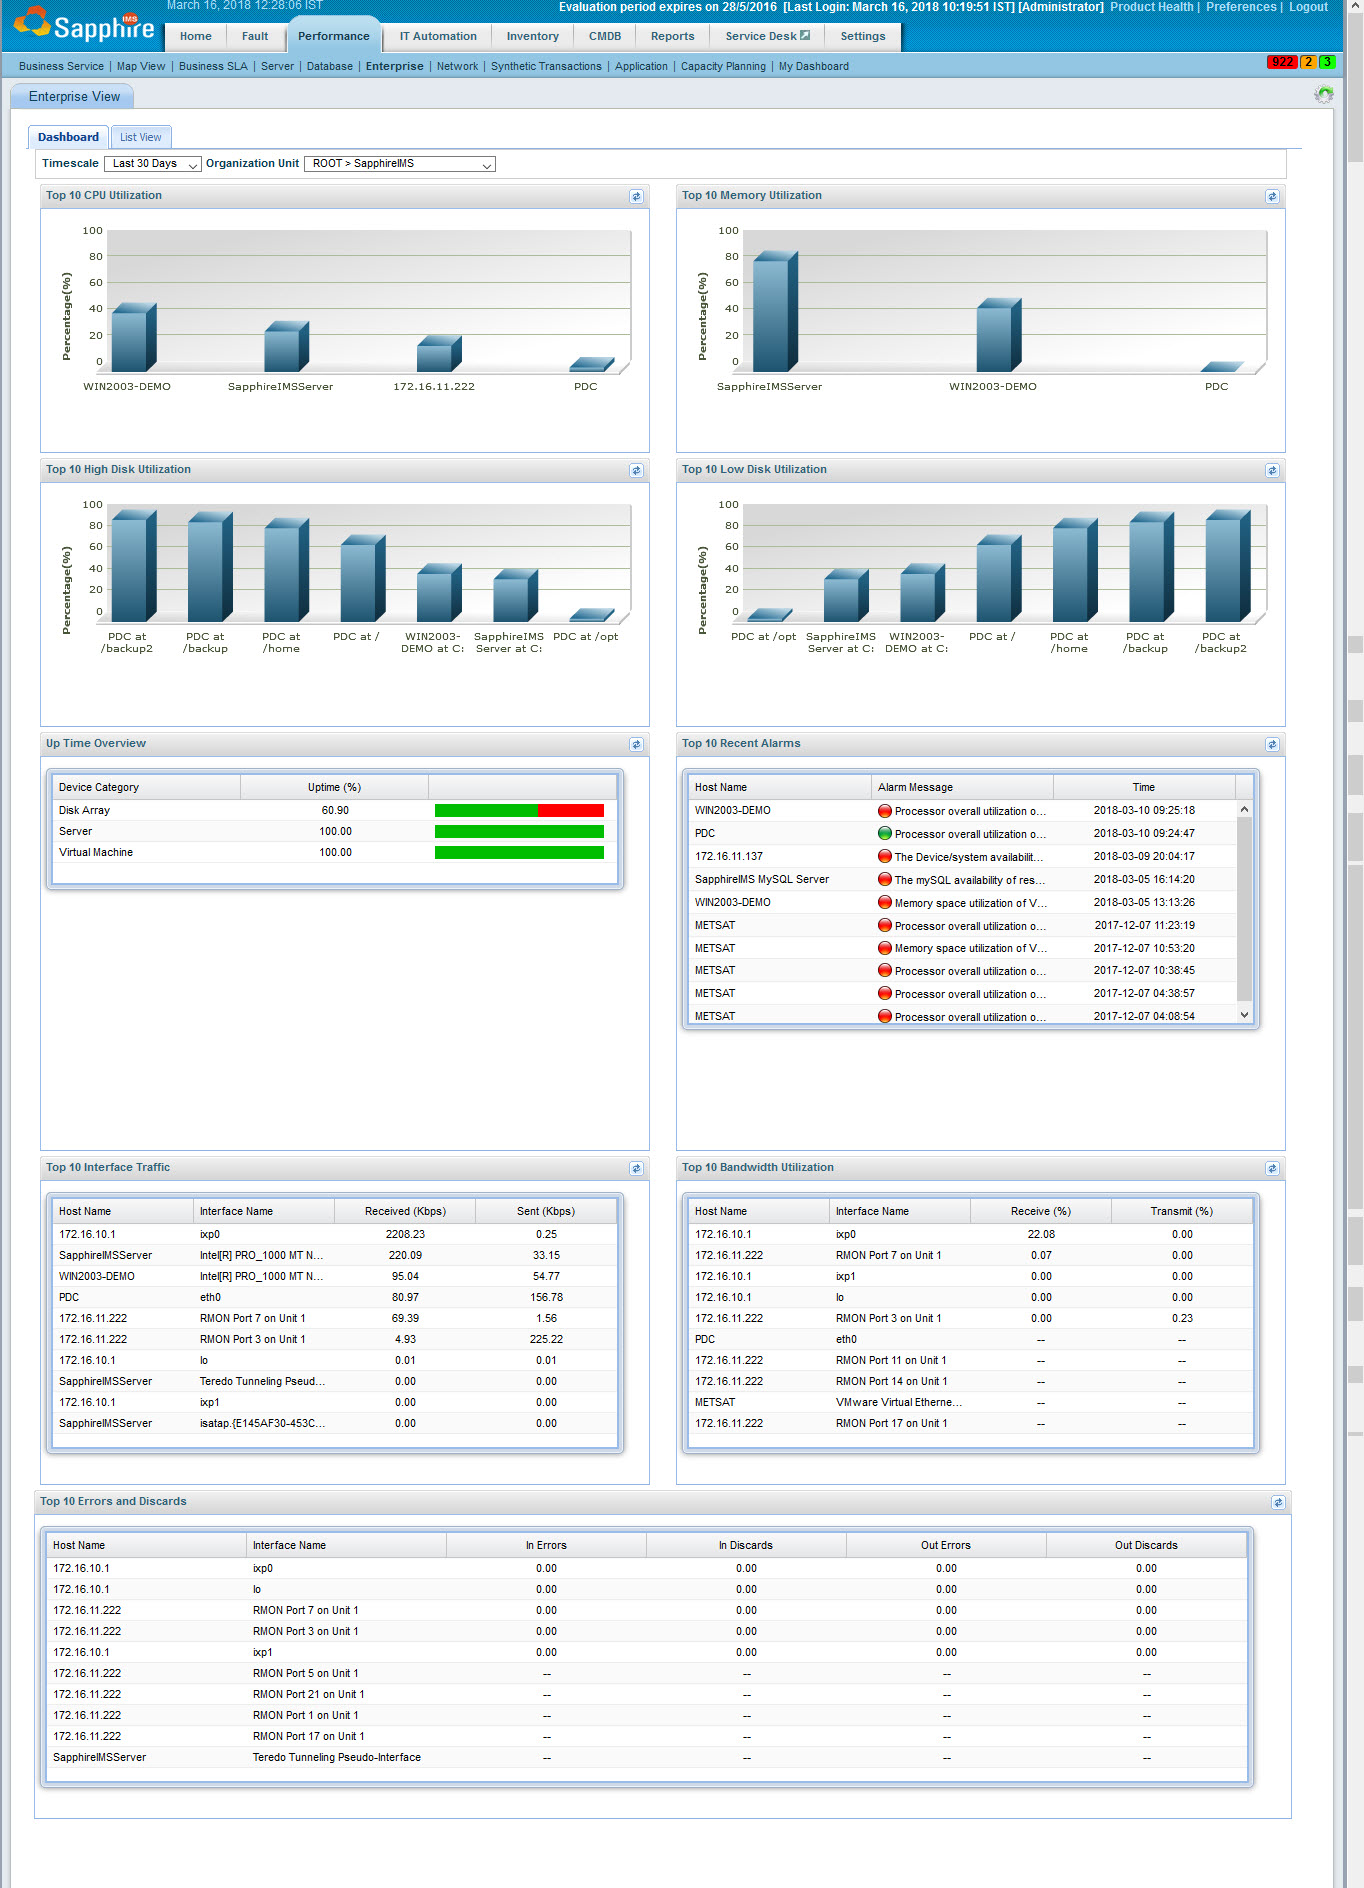
The dashboard displays the information
in the following table in a graphical view. Each bar in the
graph represents a host. The dashboard information can be filtered
based on time filters and Organization Unit (OU) by selecting 'Timescale' and 'Organization
Unit' at the top of the dashboard screen. Click on  to edit the refresh
interval. You can drill down into the individual nodes performance
by clicking on the columns of the bar charts.
to edit the refresh
interval. You can drill down into the individual nodes performance
by clicking on the columns of the bar charts.
|