![]()
![]()
The Feedback Analysis can be obtained any time based on the responses received till that point.
Click on 'Settings',
'Service Desk Configurations',
'User Survey'. Click on ![]() in
the Analysis column against the Feedback entry. The Feedback analysis
summary is displayed.
in
the Analysis column against the Feedback entry. The Feedback analysis
summary is displayed.
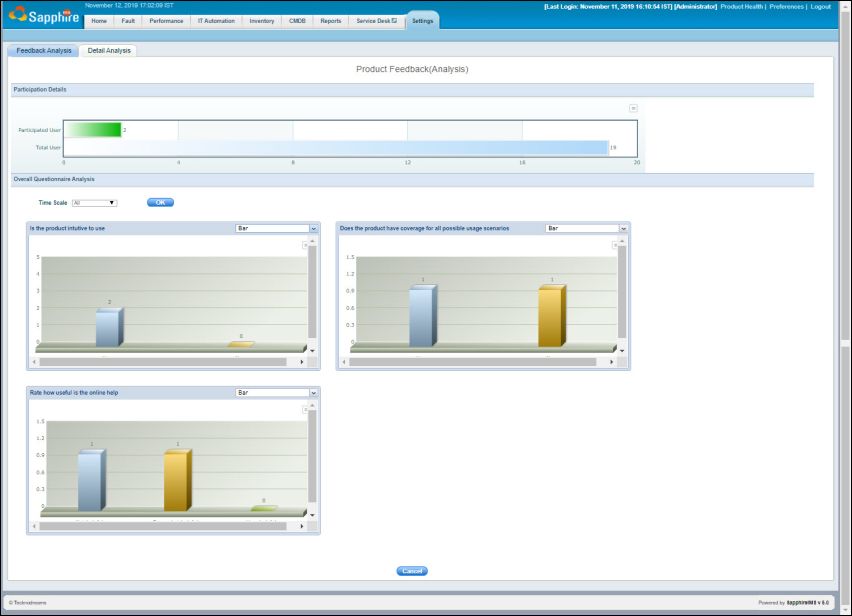
The participation analysis is provided in a bar chart followed by the charts for each of the questions in the feedback form. You can select the chart type as 'Summary', 'Bar' or 'Pie'. You can also select the time scale for the analysis.
To export any chart click on  . Select the
format in which you want to export the chart.
. Select the
format in which you want to export the chart.
Click on the 'Detailed Analysis' tab to view the details of the responses. The individual feedback responses are displayed.
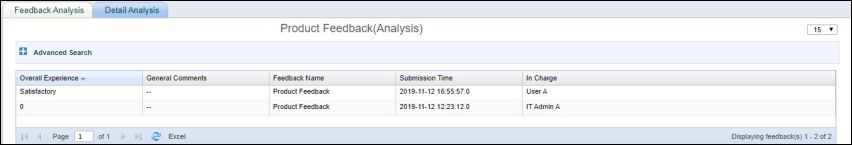
Click on the 'Feedback Name' column for any entry and a pop-up appears with the details of response to individual questions.