![]()
![]()
Operations dashboards display operational data of SapphireIMS product with respect to the IT Automation module. With real time data available as part of dashboards, the administrator can check for the overall processing of posted jobs, critical activities like master server being down for a long period which requires immediate attention, queued up jobs, jobs which requires files to be downloaded from server etc.
The data shown in the dashboards is categorized into the following logical sections:
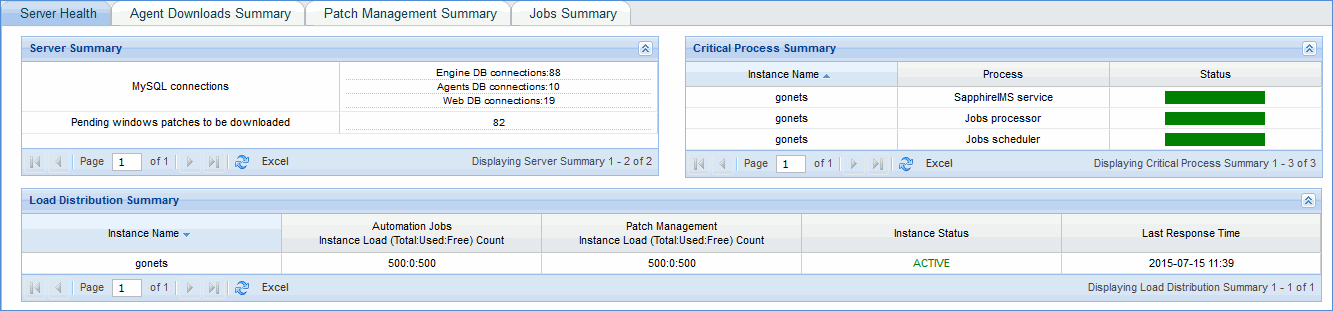
Server Health
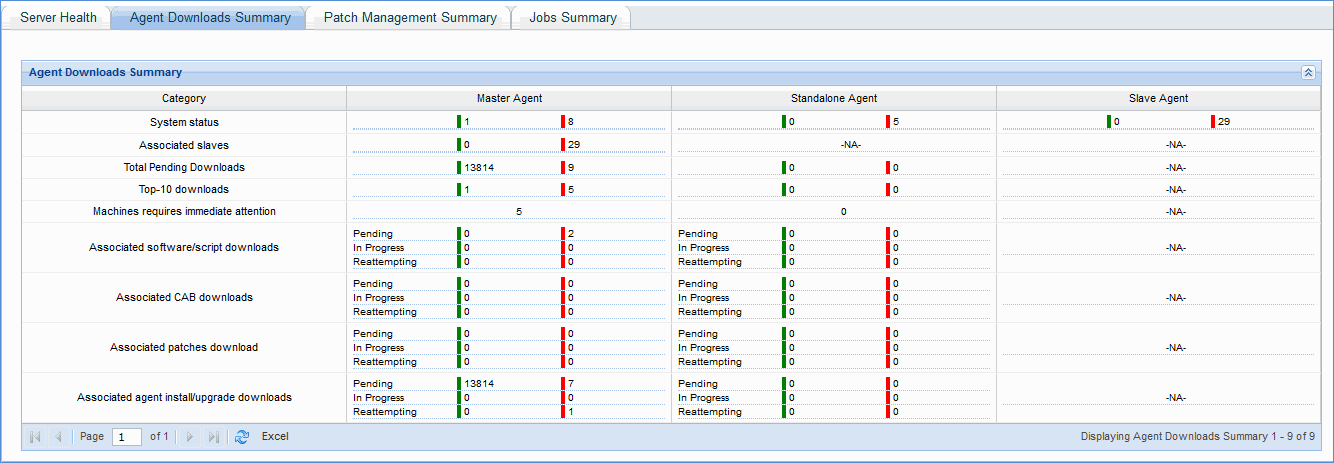
Agent Downloads Summary
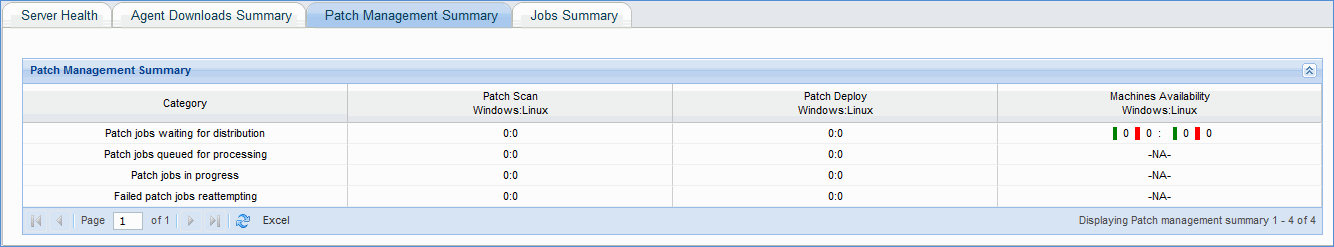
Patch Management Summary
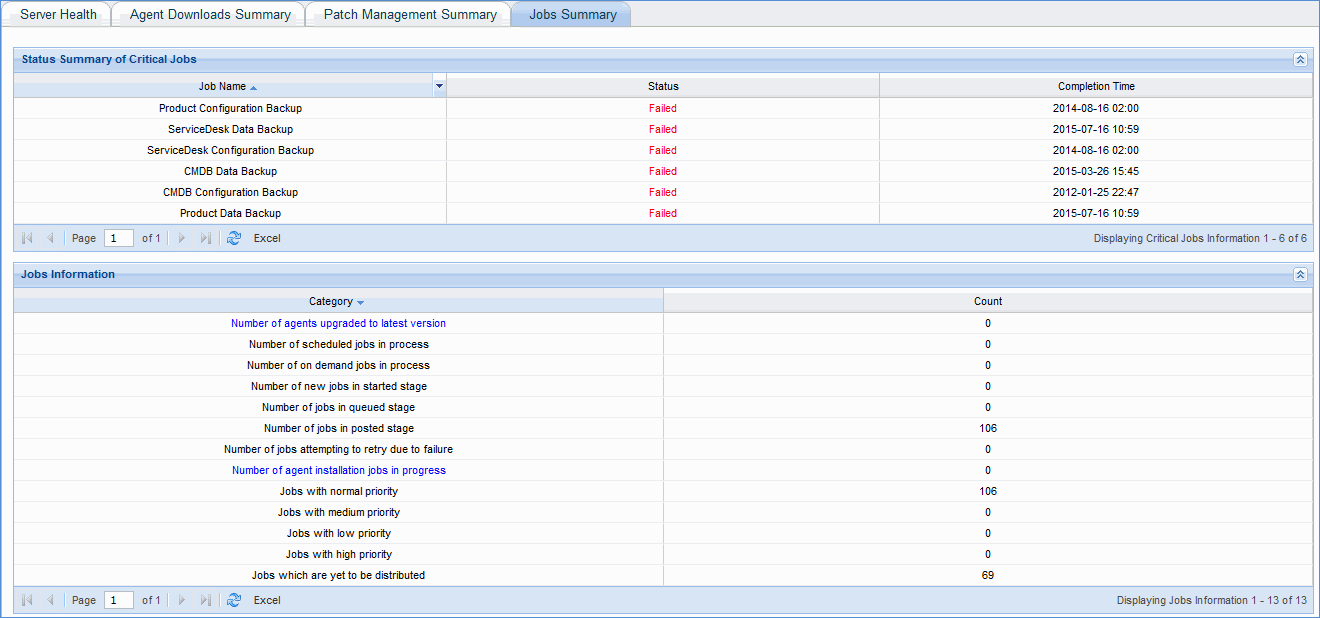
Jobs Summary
1. Server Health - This dashboard provides details relating to MySQL connections used by various modules, pending Windows patches to be downloaded from Internet, status of critical processes needed for job execution and load on various instances of SapphireIMS which includes dedicated server.
2. Agent Downloads Summary - This dashboard gives the status of downloading of software packages, script packages, Windows patches etc. by agents, master agents, standalone agents and respective machine's availability. It also highlights machines that require immediate attention.
3. Patch Management Summary - This dashboard provides the patch scan details, patch deploy details and the machine's availability status for both Windows and Linux machines for the different categories of patch management jobs.
4. Jobs Summary - This dashboard provides the status summary of critical automation jobs such as daily product backup, service desk configuration backup etc. It also provides information about agent installation jobs and various other jobs that are posted, in queue, started as well as in progress.