![]()
![]()
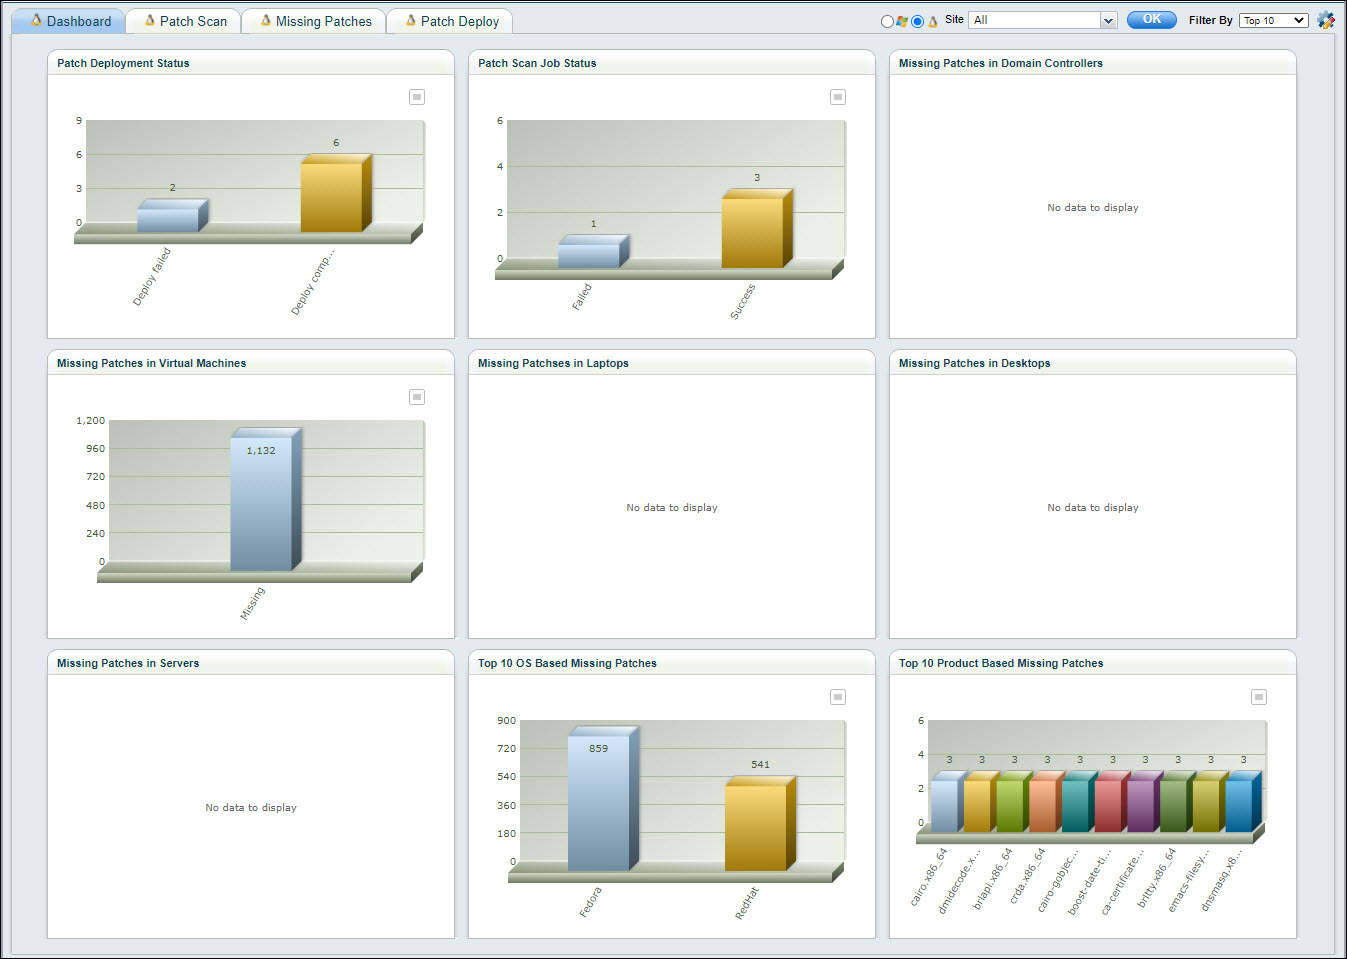
A Dashboard is available for viewing the status of patches.
 Note: This topic is applicable
for both Windows and Linux patches. Also note that Linux dashboards include
Mac patches.
Note: This topic is applicable
for both Windows and Linux patches. Also note that Linux dashboards include
Mac patches.
Hover on 'IT Automation' and click on 'Patch Management'. The Patch Management Dashboard is displayed.
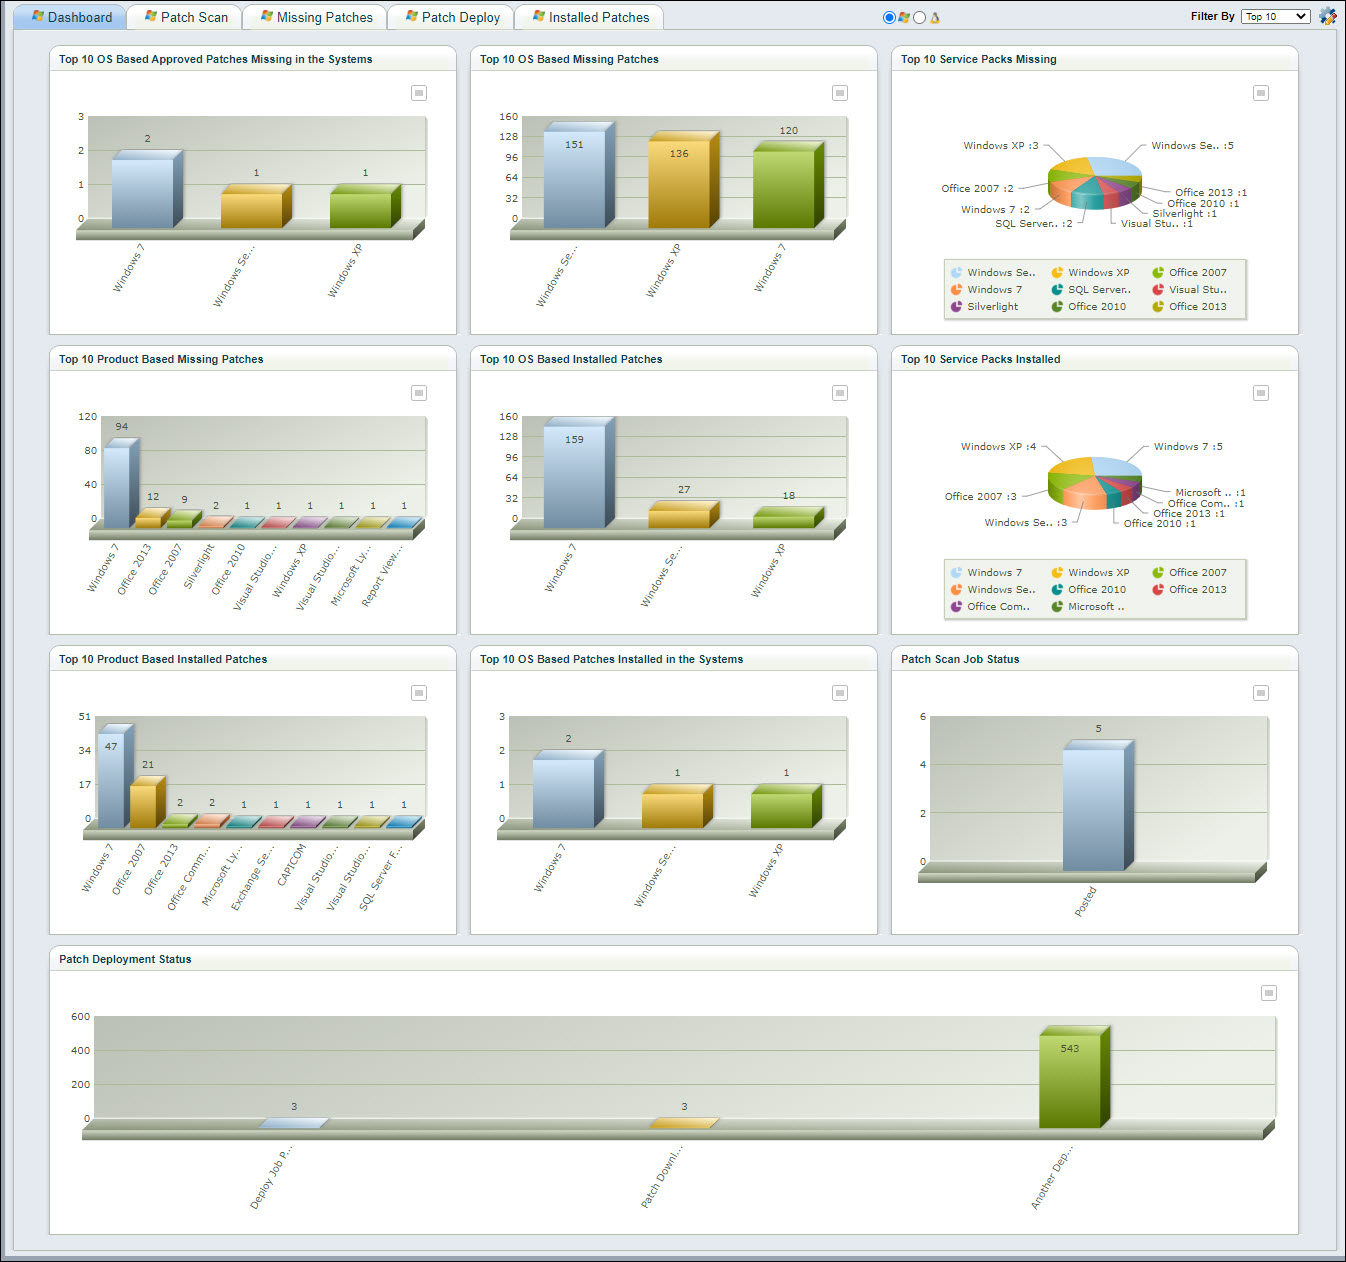
Click on one of the radio buttons
in  to select the Dashboard for Windows
or Linux.
to select the Dashboard for Windows
or Linux.
The Dashboard can be customized by
clicking on ![]() . The following screen is displayed.
. The following screen is displayed.
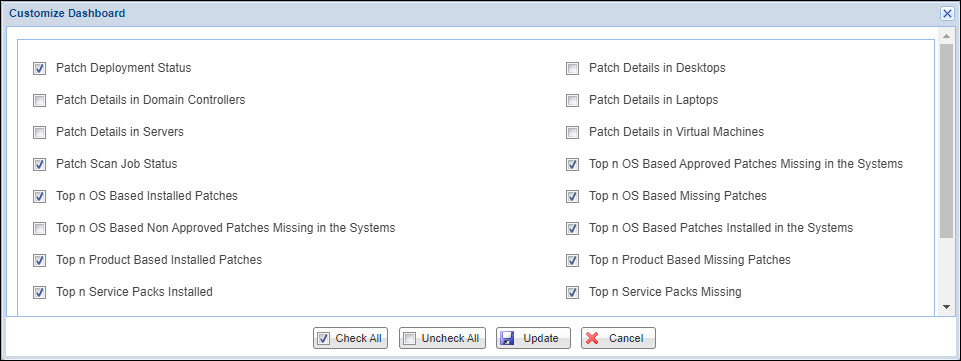
Select the Dashboards to be displayed. Click on 'Update'. You can select or unselect all by clicking on 'Check-All' or 'Uncheck All'.
There are pre-defined filters for the displays. Click on 'Filter By' to display the list of filters.
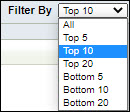
Select a filter to filter the data.
Each of the Dashboard widgets can
be exported in various formats. Click on  to display
the export options.
to display
the export options.
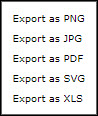
Click on any of the options to save the Dashboard widget in that format.
If Linux has been selected, then the Linux dashboard is displayed. All other functionality for the dashboard remains the same as Windows dashboards. The Mac systems are included and considered as another OS version.