![]()
![]()
SapphireIMS self health monitoring is introduced to monitor the overall product health, in the absence of which the system administrator would solely be dependant on application logs or back-end database server information for all kinds of product diagnosis.
Self-health monitoring offers the following benefits:
Product administrators can have a master health view which displays the health and other critical statistics about the installation
Master health view helps to gather a quick understanding of the overall health of individual sub-functions and also provides a pointer to the debugging guide for first level remedies
Module failures can trigger critical alerts and notifications to take proactive action
These critical alerts can also be linked to the ticketing system
Overall self-health monitoring fulfills the following objectives:
Provide overall system wise health
Provide operational wise health
Provide the necessary framework to collect log information and debugging stats
To view the product health statistics, on the SapphireIMS menu bar, click 'Product Health'

The product health dashboard is displayed as shown below:
In the 'Actions' drop down box, click 'Export' to export the product health dashboard data to a PDF file
In the 'Actions' drop down box, click 'Notification' to select the product health e-mail notification details
Check the box 'Enable Email Notification for Product Health' and select the notification profile
Include Product Support Team for Notification - This option will include product support team during notification along with above selected notification profile. Product support team e-mail address can be configured from Global Settings > Product support team e-mail ID
Product Health Inventory - This tab displays agents as well as master agent availability status, inventory data collection status and number of zombie nodes.

Product Health Performance - This tab provides details of performance enabled nodes which have become zombie nodes, performance data collection status, and virtual machine host data collection summary (if applicable)
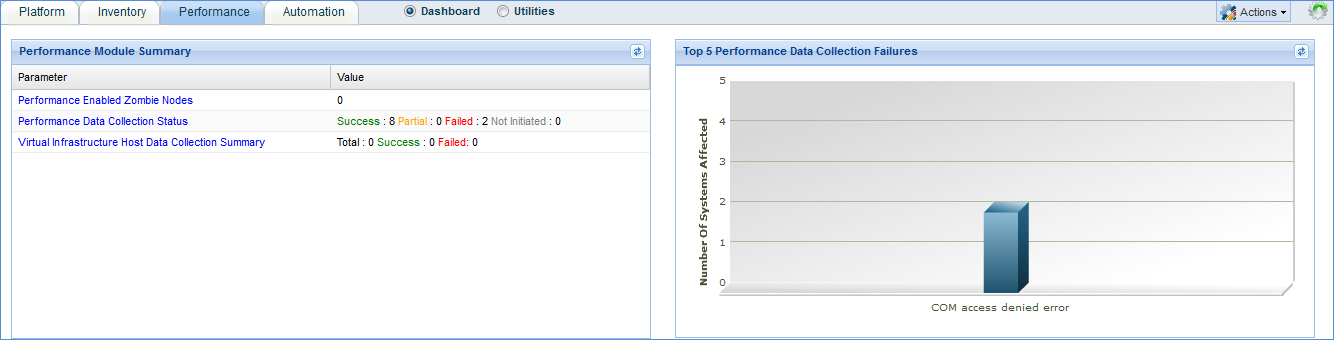
Product Health Automation - This tab provides details of the overall job scheduler health as well as job process health
Utilities
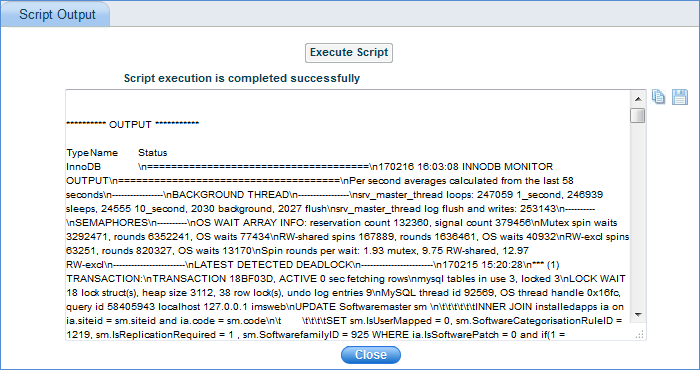
Note: Show InnoDb status is a default script package which displays extensive information from the standard InnoDb monitor about the state of the InnoDb storage engine (used by MySQL server) like Latest detected deadlock, No. of transactions, latest foreign key error, file I/O, Insert buffer and Adaptive hash index
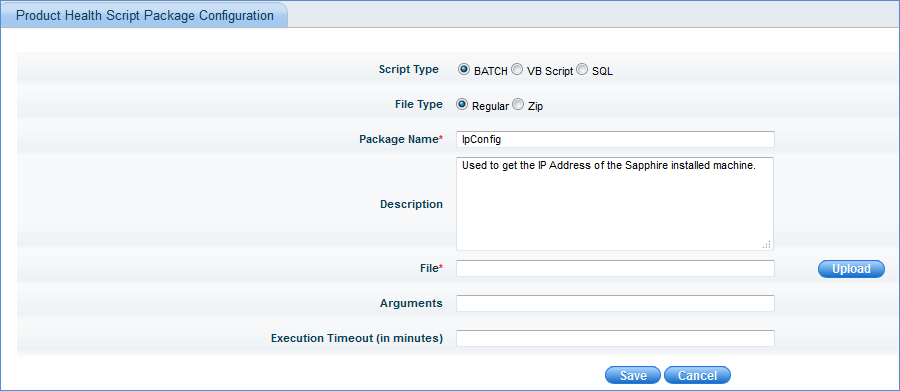
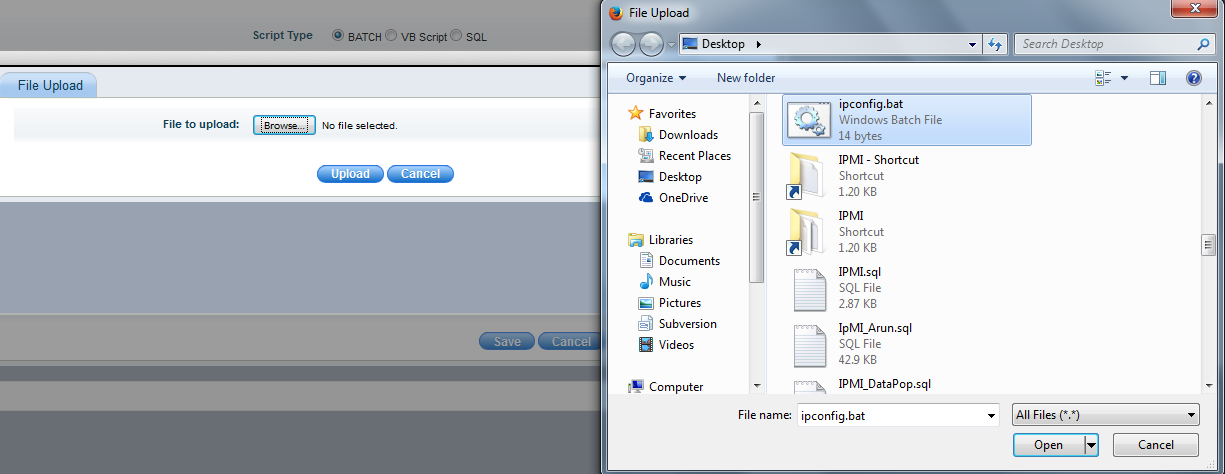
Click 'Create Script' to create a user defined script package which can be executed to perform a specific task e.g. retrieve information from the SapphireIMS installed system.
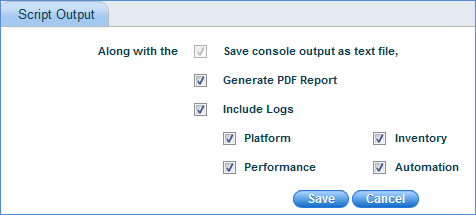
Click the save icon '![]() '
to generate the zip file which contains the executed script output,
PDF report of product health and logs of the selected modules
'
to generate the zip file which contains the executed script output,
PDF report of product health and logs of the selected modules