Custom Reports
Custom Reports feature is provided in case
the desired report is not listed in the system reports. Custom Reports
allows you to generate category based reporting with filter options.
To create a new customized report follow
the steps given below:
1. On the SapphireIMS menu, point to 'Reports' and click 'Monitoring
Reports'
2. Click 'Custom
Reports' tab.
3. All the reports that are created earlier
will be listed in this screen. To create a new report, click 'ADD'.
and follow the steps given in the section below.
Creating a New Custom
Report
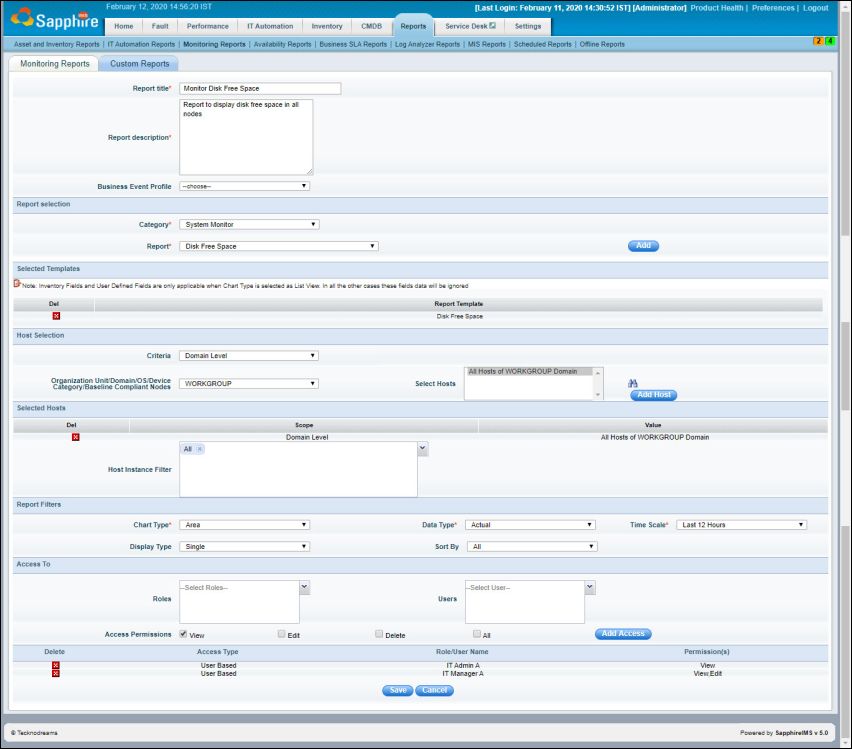
Custom Report
Sr.
No |
Field
Name |
Description |
1 |
Report Title
|
The title of the report |
2 |
Report Description
|
Brief description of the report to
be created. |
3 |
Business Event Profile |
Select the Business Event Profile
during which the data has to be displayed. |
4 |
Reports Selection |
Select the Category
System
Monitor [Used for report templates related to system monitor
that includes Disk/ CPU/ Memory/ Interface/ Paging/ Disk IO etc.]
Synthetic
Transaction Monitor [Used for report templates related
to service monitor that includes HTTP/ E-mail/ FTP/ DNS/ Radius/
TCP etc.]
Application
Monitor [Used for report templates related to system monitor
that includes MySQL/ MSSQL/ Oracle/ Active Directory/ Exchange
Server/ IIS]
Database
[Used for report templates related to databases that are being
monitored in Windows systems]
Business
Service Monitor [Used for report templates related to performance
data]
Stacked
Reports [Used for report templates related to stacked display
of data]
Select the Report (Based on the category
selected above, templates that match the category will get listed)
Click ‘Add’ to confirm the selection.
You can continue to add more report templates as part of the same
report
|
5 |
Host Selection |
Use this section to add devices for
which the report needs to be generated.
Select the criteria for host selection
Select the OU/Domain/OS/Device Category/Baseline
Compliant Nodes if applicable
Select hosts lists the available hosts
based on the filter conditions selected. Select the host and click
the ‘Add Host’ button.
|
6 |
Host Instance Filter |
Displays
the list of instances available for the selected hosts/monitors.
Select the instances for which the report rule would be applicable.
For instance if the selected monitoring
type is ‘Application Monitor’ and the resource selected is 'MySQL',
then this displays all the available 'MySQL’ instances that
are currently configured to be monitored.
|
7 |
Report Filters |
Chart Type - Select the chart type
which selects the format for the report
Data Type - Select 'Actual' or 'Summarized'
which displays the raw or summarized data.
Time Scale - Select the time scale
for which the report needs to be generated. If 'Custom
time' is selected you need to specify the 'From'
and 'To' times.
Display Type - Select 'Single' or 'Multiple'
display type for the report
Single
– This will list each parameter as an individual graph
Multiple – This will break up each
parameter/instance as a separate graph
Sort By - Select the sort option for
the report. By default the report is generated for all the instances.
If a filter option is selected (say top 2) then the report will
get generated with the filter option selected (top 2 instances
in this case)
|
13 |
Access To |
Roles: Select the Role(s) for which
all users who are allocated the role will have the report access.
Users: Select the User(s) for whom
the report access needs to be provided.
If no user is selected then the report
would be available to the user who has created the report, by
default
Access Permissions: Select the appropriate
checkbox to provide 'View',
'Edit', 'Delete'
or 'All' access permissions.
Once the users/roles and access permissions
are selected, click on 'Add'
to add the access. |
|
Note:A system report
can also be created by using the save option while viewing data using
the ‘performance’ tabs. The report thus created will also be listed in
the system report screen
Viewing
a Custom Report
Note:
Pdf graphs for Single display type are displayed based on two setting
keys
1.
Setting key 'Split Charts in BSM PDF Reports by Days' - If this
setting key is set to 1, the Pdf graph is split based on the number of
days (For e.g. if there is a report created to display the CPU Usage for
2 servers for last 7 Days, then 7 charts will be created in the report
where each chart will show the CPU Usage for a single day for 2 servers.
If this Settings Key is set to "0" then the charts in the BSM
PDF Reports will be split by Chart Data Point Limit (e.g. if there is
a report created to display the CPU Usage for 2 servers for last 7 Days
and the total Data Points to be displayed are 5000, then 2 charts will
be created in the report where each chart will show the CPU Usage for
2 servers with 2500 Data Points (Note: by default the Chart Data Point
Limit is 1200. This limit can be increased up to 2500 Data Point per Chart)
2.
Setting key 'Data Point Limit for each Chart in BSM PDF Reports'
- default value is 1200

The filters as displayed below can be used
to view the report in different forms. Refer to the table below
to know the usage of the filters.
Sr.
No |
Field
Name |
Description |
1 |
Report
Type |
Each
built-in report has a default chart type associated with it. This
can be changed using this option
|
2 |
Filter
By |
Displays
the list of filtering options. If a filter option is changed (say
top 2) then the report will get re-generated with the filter option
selected (top 2 instances in this case)
|
3 |
Display
Type |
There
are two kinds of display mode
Single – This will list each parameter
as an individual graph
Multiple – This will break up each
parameter/instance as a separate graph |
4 |
Time
scale |
Change
the time scale, and the report gets re-generated with the selected
time scale. |
5 |
Custom
Time |
Select
a custom time using the ‘From’ and ‘To’ option. The report would
then be re- generated with the time frame that is selected here.
|
6 |
.gif) |
Saves
the report as a PDF
|
7 |
 |
Enables
the report to be mailed to others.
|
|
Editing a Custom Report
Deleting a Custom Report