![]()
![]()
This topic describes how to add new Inventory Summary and Inventory Analytical Reports.
Inventory summary reports display inventory details based on the filters selected.
On the SapphireIMS menu, point to 'Reports' and click 'Asset and Inventory Reports'.
Click the ‘Inventory Summary Reports’ link. Click the ‘Add’ button. A screen to enter the report details is displayed. As an example, the report below displays inventory BIOS details for all hosts of SapphireIMS OU, with Microsoft Windows as the operating system.
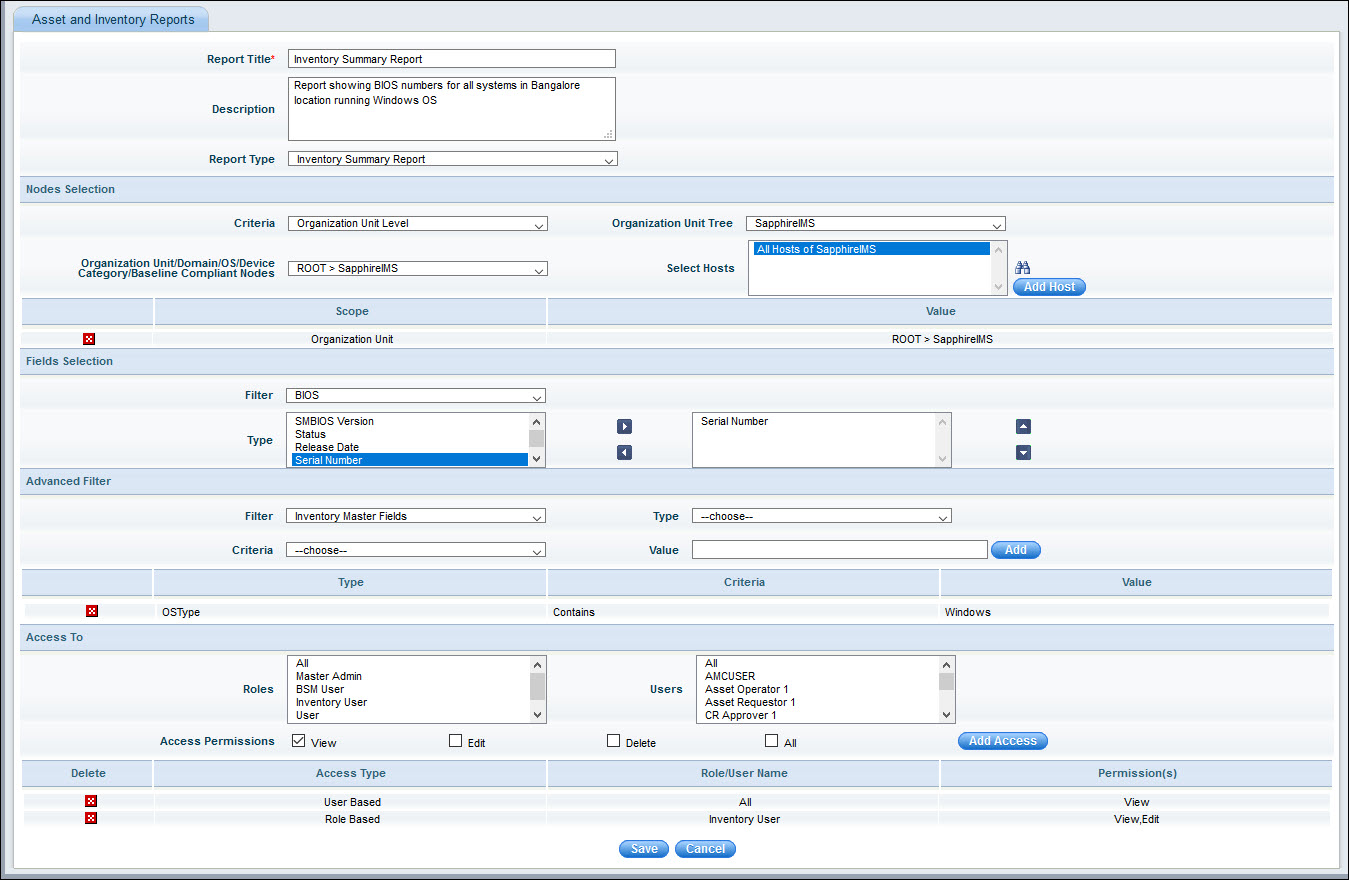
The fields are described below.
|
Enter the fields and click on 'Save'. The report gets added and appears in the report list.
Inventory analytical reports display the inventory count based on the fields selected.
Click 'Reports', 'Inventory & Asset Reports'.
Click the ‘Inventory Analytical Reports’ link. Click on the ‘Add’ button. The report creation screen is displayed. As an example, the report below displays the count of all Windows OS systems in a specific domain.
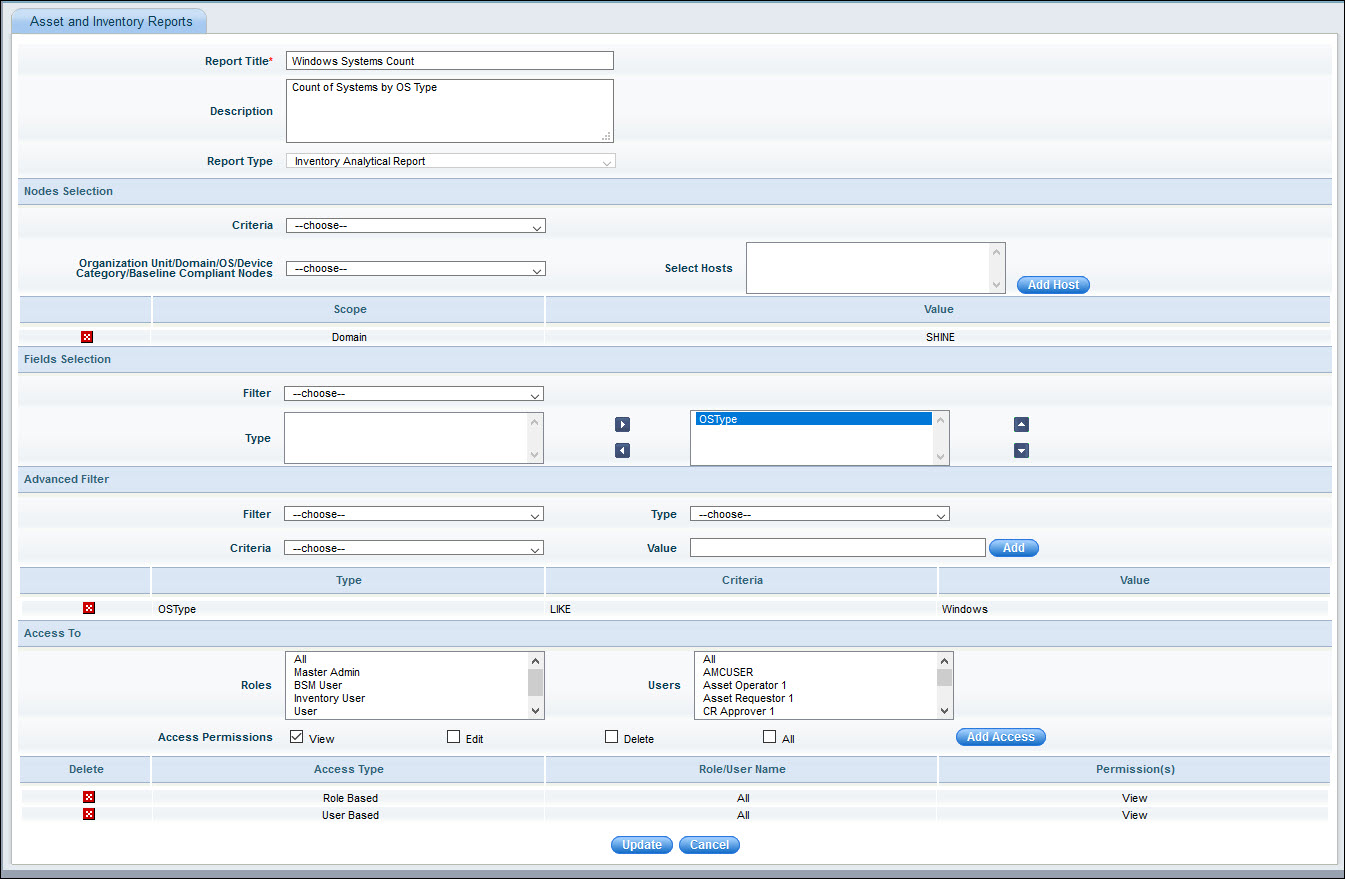
The fields are similar to Inventory Reports. Note that the count is based on the fields which are selected. In the above report, the count is based on 'OSType' and further it is filtered and the report limited to Windows systems only.
Enter the fields and click on 'Save'.
The report appears as below.

Inventory Chart Reports display the reports in a chart form. There are various type of reports including 'Top N' and distribution reports.
Click 'Reports', 'Inventory & Asset Reports'.
Click the ‘Inventory Chart Reports’ link. Click on the ‘Add’ button. The report creation screen is displayed. As an example, the report below shows the distribution of systems by Processor type.
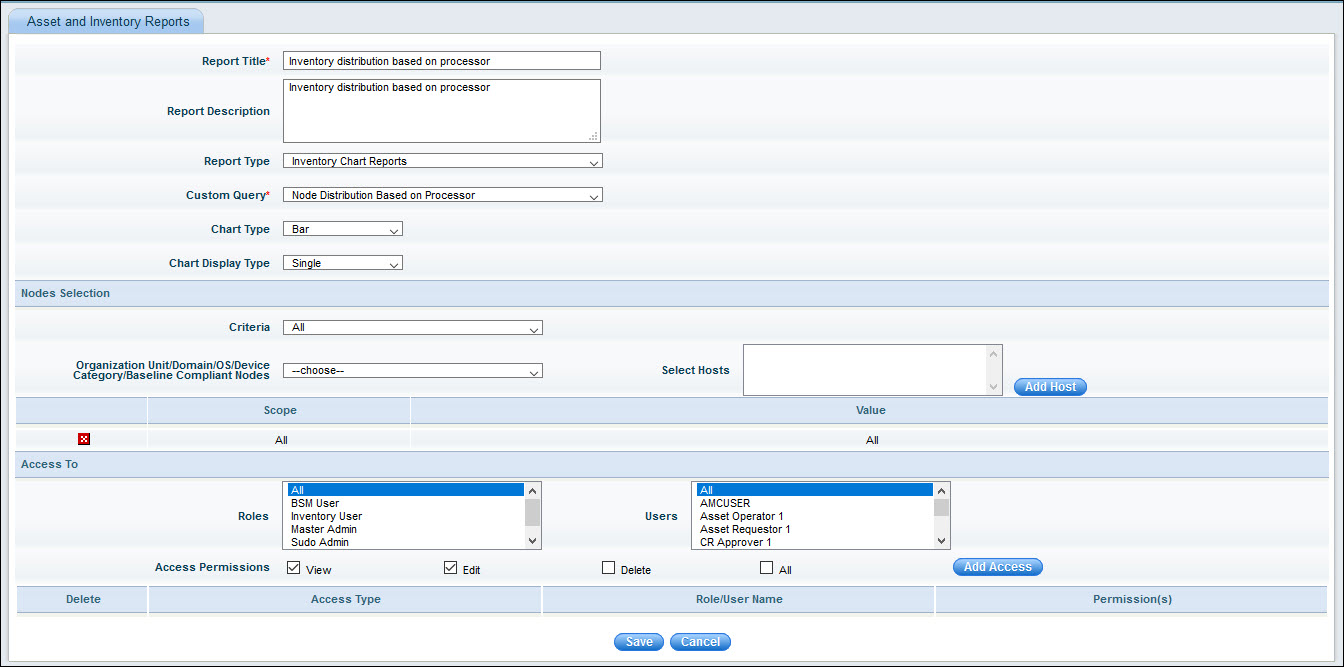
The fields are similar to Inventory Reports. Select the Custom Query from one among the pre-shipped queries. Select the 'Chart Type' as a 'Bar', 'Pie', 'Summary', 'Stacked Bar' or 'Trend'. Select the 'Chart Display Type' as 'Single' when all the parameters are shown on the same graph or 'Multiple' for breaking up and showing a separate graph for each parameter.
Enter the fields and click on 'Save'.
The report appears as below.
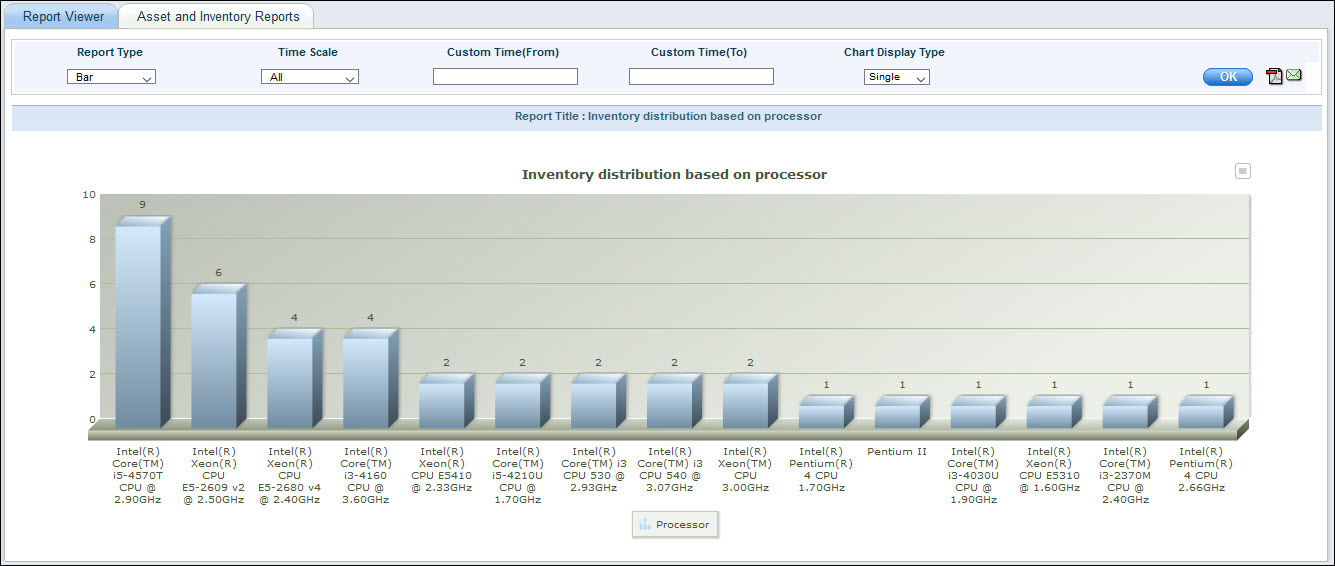
You can change the time filter (for relevant reports) or the chart type and chart display type and click on 'OK'.
To
export the charts in various formats hover on  and
select on the specific format for export. You can select .PNG, .JPG,
.PDF, .SVG or .XLS formats.
and
select on the specific format for export. You can select .PNG, .JPG,
.PDF, .SVG or .XLS formats.