![]()
![]()
SapphireIMS provides an added Business Service Management feature called Map, which is a graphical representation of the health and availability of a configured business service with user defined connectors between the nodes/resources that are configured for BSM view.
Click Performance > Map View to display the Map View.
The configured network topology maps are displayed as shown below.
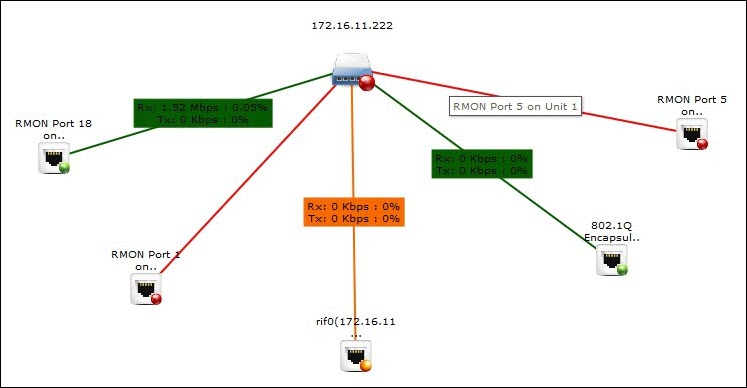
Network Topology Map
The network traffic and utilization on the interfaces are displayed. Following is an example of display of traffic on the interfaces on a switch.
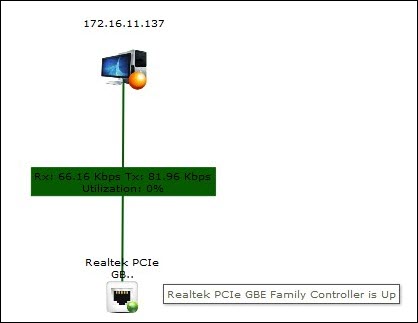
Following is an example of display of traffic on the interfaces on a desktop. In this case the inbound and outbound utilization is combined and shown.
The configured Business Maps are displayed as shown below.
Business Maps
The split of alarms as Info, Warning and Critical is displayed along with the counts. Clicking on any alarm indicator, causes the Alarm List View to be displayed in a pop-up containing the alarm details.
Availability and health parameters will be shown in the tree panel
Click on ‘Availability’ to view the configured availability parameters in the right panel
Click on ‘Health’ to view the configured health parameters in the right side panel
Mouse over will show hostname->Parameter Name->Instance Name
Eg: Astro->Disk Utilization->C:
1. Click
the icon  . This will list the
set of operations that can be performed on a configured map
. This will list the
set of operations that can be performed on a configured map
2. Click
the  icon to associate CI
with the business rule
icon to associate CI
with the business rule
3. Click the
 icon
to set the refresh interval. This will refresh the right panel i.e. the
complete map layout
icon
to set the refresh interval. This will refresh the right panel i.e. the
complete map layout
4.
Click the  icon to redirect to the business
service dashboard. By normal means the dashboard page can be view by navigating
to Performance->Business Service
icon to redirect to the business
service dashboard. By normal means the dashboard page can be view by navigating
to Performance->Business Service
5. Click
the  icon to view the map in full
screen mode
icon to view the map in full
screen mode
6. Click
the  icon to view the graph view
for all the parameters configured in the business service rule
icon to view the graph view
for all the parameters configured in the business service rule
7. Click the  icon to redirect to the manage maps
screen. By normal means the dashboard page can be viewed by navigating
to Settings->Business Service Monitoring->Manage Maps
icon to redirect to the manage maps
screen. By normal means the dashboard page can be viewed by navigating
to Settings->Business Service Monitoring->Manage Maps
8. Click the
 icon.
This will the list the alarms generated for the parameters configured
in the business rule with alarm count. Click on the alarm count to view
the list of alarms generated.
icon.
This will the list the alarms generated for the parameters configured
in the business rule with alarm count. Click on the alarm count to view
the list of alarms generated.
Alarms
Information is displayed with severity