![]()
![]()
SapphireIMS allows you to design customized reports in case the in-built reports do not meet the needs. The custom reports can be created fresh or an existing in-built report can be copied and modified.
Select 'Custom Reports' to display the list of custom reports.
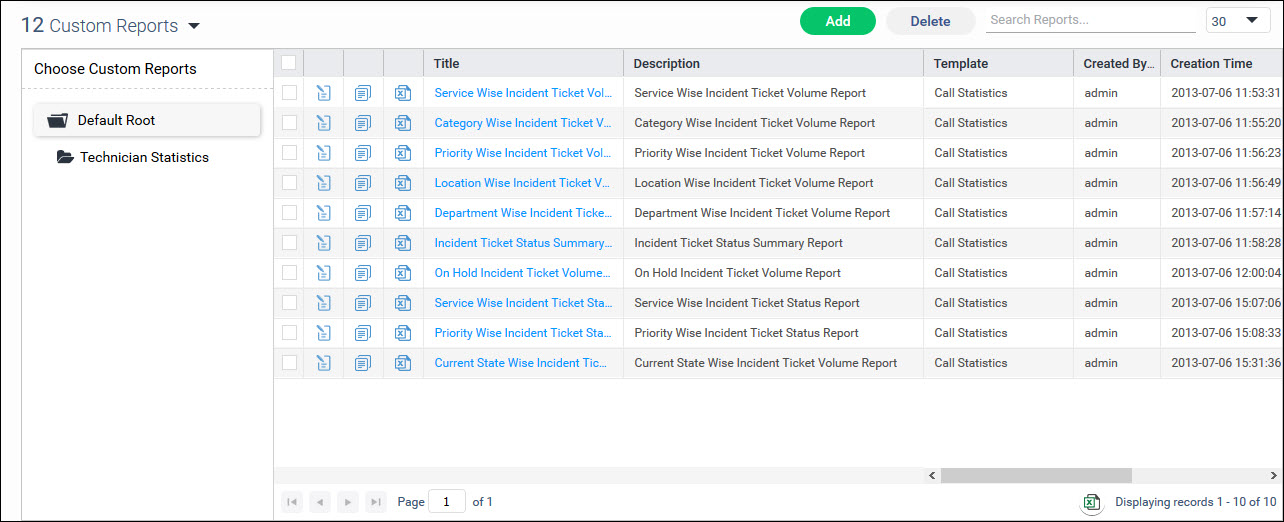
The reports are organized as groups in a tree hierarchy. The 'Default Root' node is in-built. While creating a report, the group to which it belongs can be specified. Click on any node in the hierarchy and the corresponding reports are listed on the right side.
Click on 'Add' to add a new report. A blank screen to configure the report is displayed.
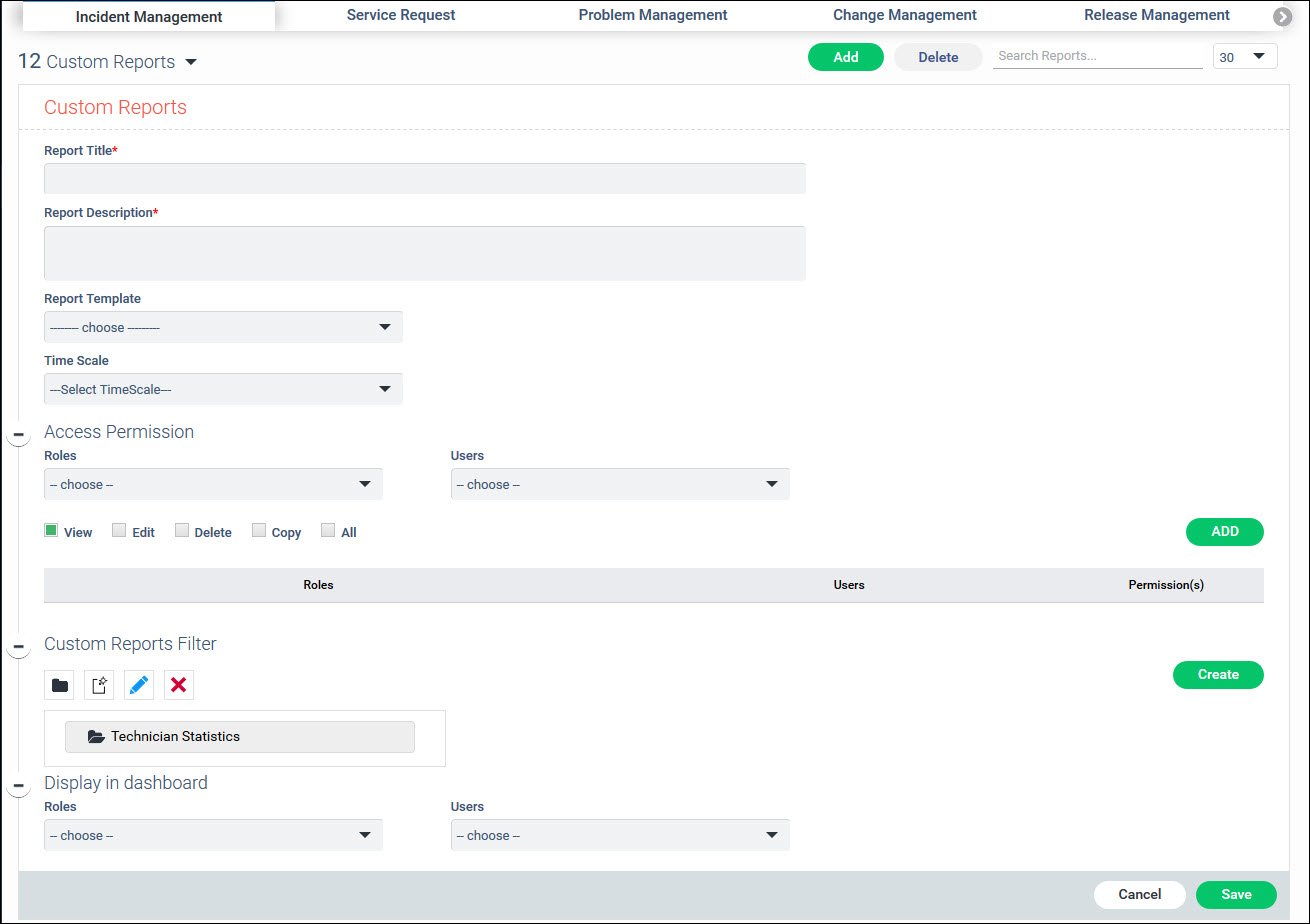
The fields are described in the table below.
|
On entry of the fields, click on 'Save' to save the report.
The report will be visible on the report listing view and you can click on it to run.
Click on a report to display it.
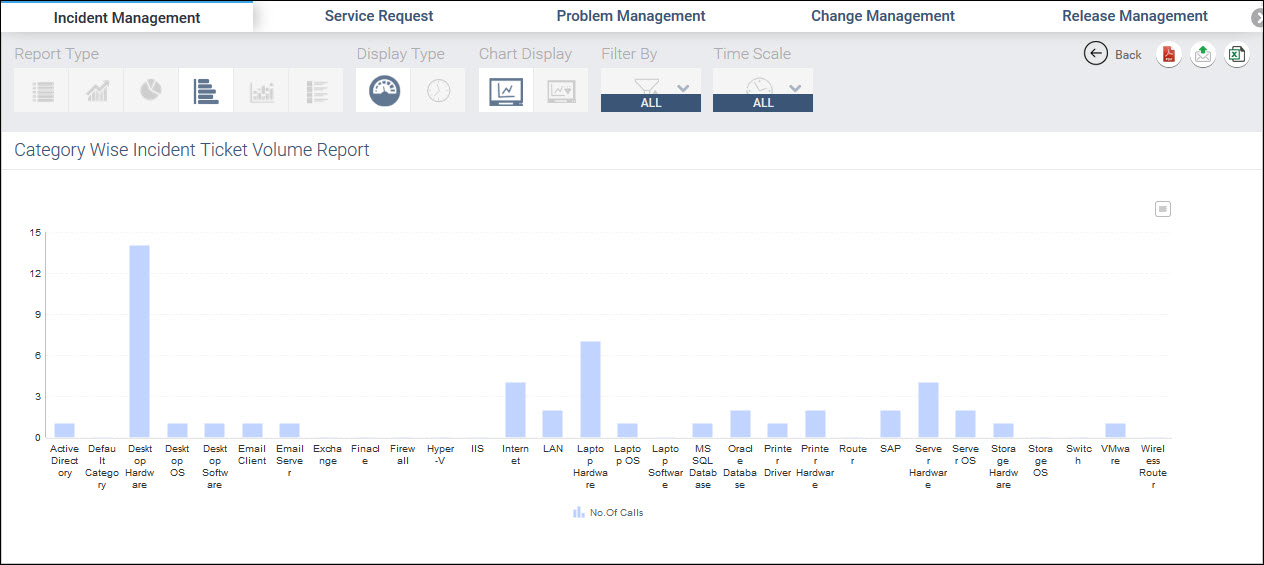
There are a number of report types supported
Summary (Tabular format)
Trend
Bar
Stacked Bar
Statistical Summary
Refer to the topic In-built Reports for details on the report types.
In addition the 'Display Type' can be selected as 'Cumulative' in which case the cumulative data is displayed or as 'Time Based' in which case the data for a selected period of time is displayed.
'Chart Display' can be selected as 'Single' or 'Multiple' to display a single chart or multiple charts.
'Filter By' is used to filter entries by 'Top N'.
'Time Scale' can be used to select a time period for the report.
Reports can be exported to Excel or PDF or sent via e-mail. Refer to the topic In-built reports for a description.
Select one or more reports and click on 'Delete' to delete the reports.
You can also start with an existing In-built report and make
customize it. To do this click on Copy Report icon  against the selected report in the In-built report listing view. The
Copy Inbuilt Report screen is displayed.
against the selected report in the In-built report listing view. The
Copy Inbuilt Report screen is displayed.
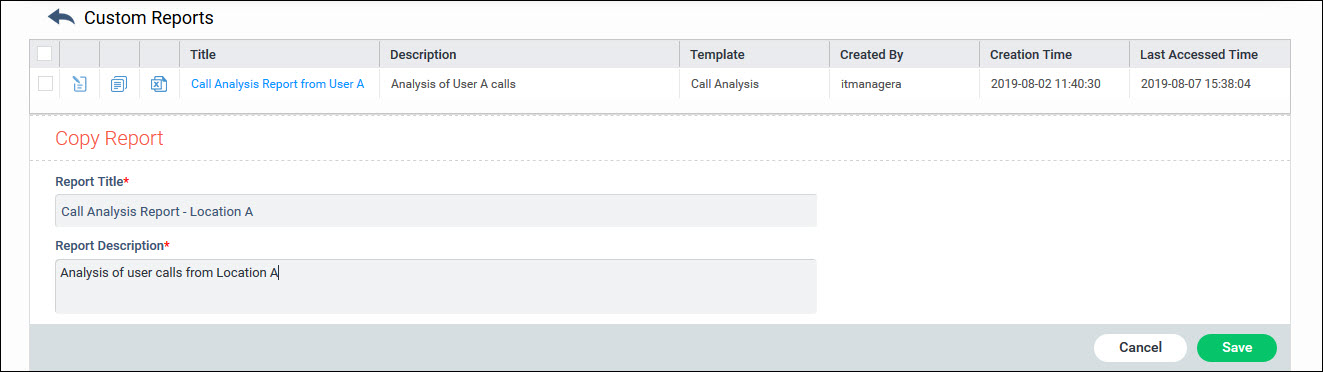
Enter the 'Report Title' and 'Report Description'. Click on 'Save'. The report now gets saved under the Custom Reports listing view with the new report title.
You can edit the report details and further customise.
Custom Reports can be scheduled for periodic report generation and sent via e-mail to recipients or made available for offline viewing. Refer to the topic Service Desk->Reports->Scheduled Reports for details.
 Note: If you have
a reporting requirement outside of the templates provided, please
contact SapphireIMS Support.
Note: If you have
a reporting requirement outside of the templates provided, please
contact SapphireIMS Support.  to get a Time
based report where the time interval is fixed (hourly,
daily, monthly etc.)
to get a Time
based report where the time interval is fixed (hourly,
daily, monthly etc.) to get the cumulative
report (default)
to get the cumulative
report (default) . If
this is the first node, click on '
. If
this is the first node, click on ' .
. to edit the name of the node or leaf.
 to delete a node or leaf.