![]()
![]()
 Note: In order to make the
dashboard as the landing page after logging in, create a new role, provide
the permission to the appropriate modules and map the user to this role.
The built-in roles for Inventory and BSM take the user to the listing
views and this cannot be changed. For creating roles and users refer to
Settings->User
Management->Overview.
 Note: The dashboards which
you can view depend on the access control provided to your role. Refer
to Settings->User
Management->Roles->Access Control Profiles for setting
the access control.
The Home dashboard consists of multiple individual dashboards each of which is explained below.
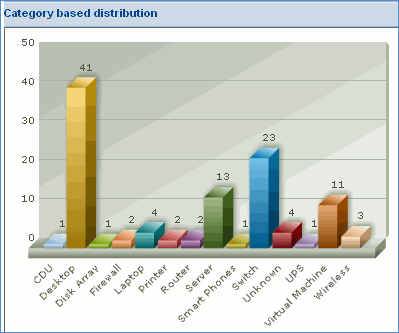
Category based distribution - This dashboard displays the category of devices with respect to the total count of devices.
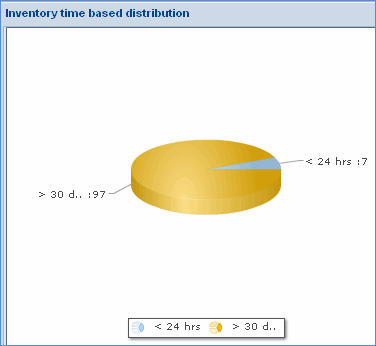
Inventory based distribution - This dashboard displays the inventory collection of devices with respect to time.
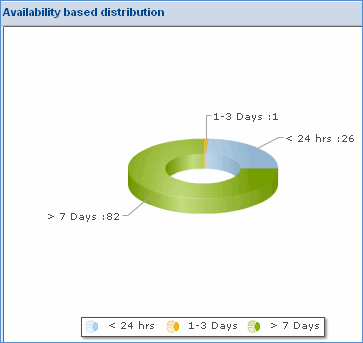
Availability based distribution - This dashboard displays the availability of devices with respect to time.
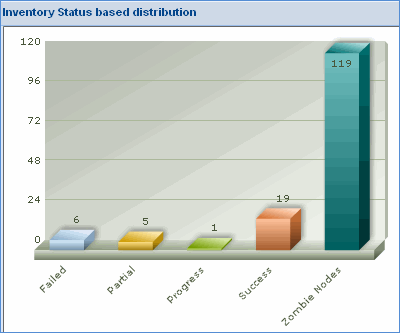
Inventory Status based distribution - This dashboard displays the inventory collection status of devices with respect to the total count of devices.
Sometimes, Sapphire is unable to collect data from devices due to various reasons which could be non-availability of the system, connectivity issues etc. If data for such a device is not collected for more than 30 days, then such a device is termed as a ‘Zombie Node’. Zombie nodes are visible in the Inventory Status Based Distribution dash board as shown above.
Click on the ‘Zombie Nodes’ bar to drill down to view the device details.
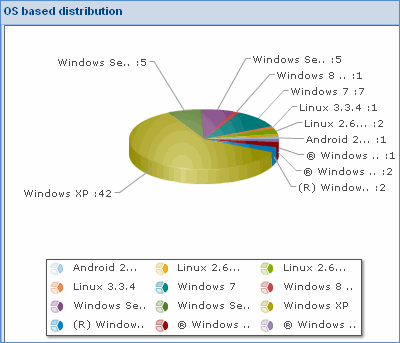
OS based distribution - This dashboard displays the distribution of operating systems across the network
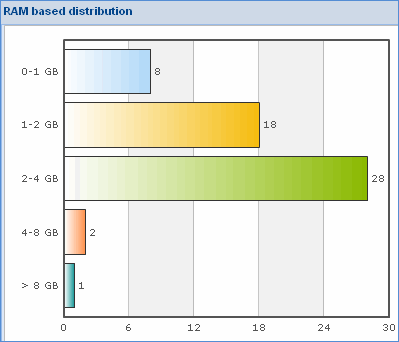
RAM based distribution - This dashboard displays the distribution of RAM with respect to the total RAM available for the devices
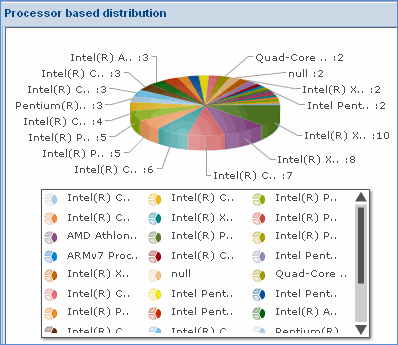
Processor based distribution - This dashboard displays the distribution of processors across the network
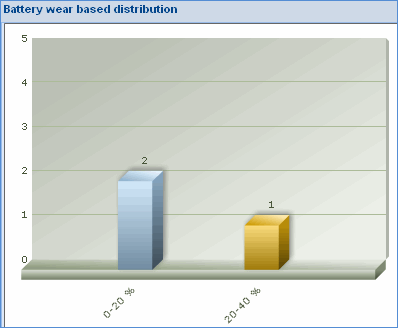
Battery wear based distribution - This dashboard displays the battery wear or the full charge capacity of laptop computers against the original capacity.
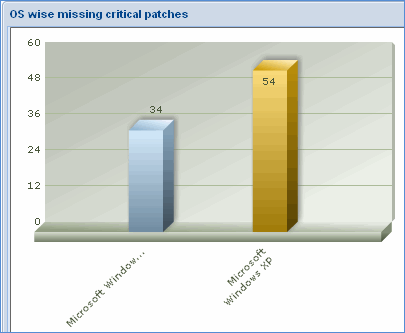
OS wise missing critical patches - This dashboard displays the missing patches OS wise with respect to the total number of missing patches.
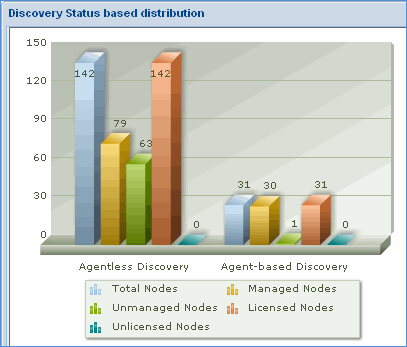
Discovery Status based distribution - This dashboard displays the number of discovered nodes both agent less as well as agent with respect to the count of nodes.
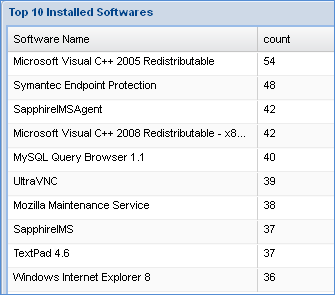
Top 10 Installed Softwares - This dashboard displays the top ten installed software across the network.
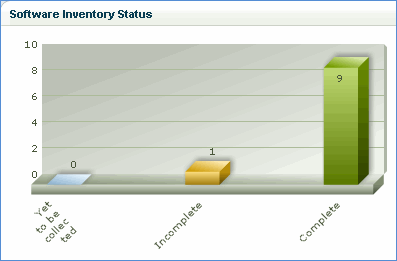
Software Inventory Status - This dashboard displays the status of installed software inventory collection
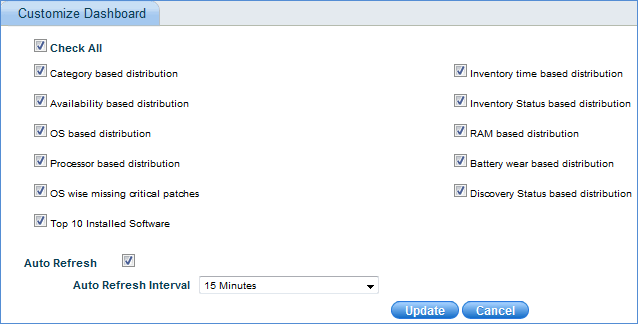
Note: To customize
the view of dashboards to be displayed, click the '![]() '
, and select the dashboards of your choice.
'
, and select the dashboards of your choice.
Enter the Display Order of the dashboards to be viewed
Enter the seconds to auto refresh the page
Click 'Update'
