![]()
![]()
SapphireIMS supports monitoring of databases. Apart from availability and alarms, there are other performance attributes which are monitored. To configure databases for performance monitoring, go to 'Settings > Business Service Monitoring > Application Performance'. For more information refer to Settings->Business Service->Application Performance.
On the SapphireIMS menu, point to 'Performance' and click 'Database'. The listing for the databases configured for performance monitoring is displayed as shown below.
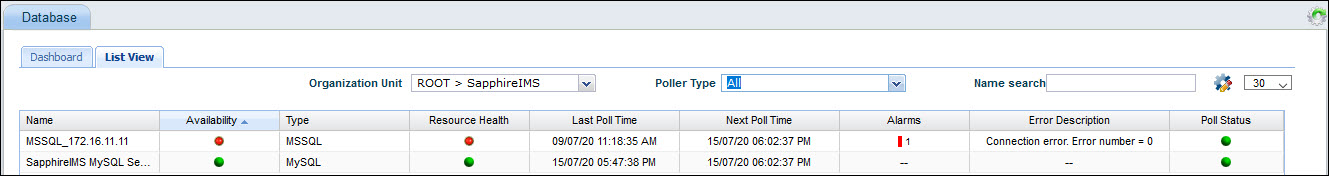
Select an 'Organization Unit' to filter the search. You can also search for a specific Poller Type or Database name.
The split of alarms as Info, Warning and Critical is displayed along with the counts. Clicking on any alarm indicator, causes the Alarm List View to be displayed in a pop-up containing the alarm details.
Click on the database name to get a detailed view of the performance attributes.
On the SapphireIMS menu, point to 'Performance' and click 'Database'. Click on 'Dashboard'.
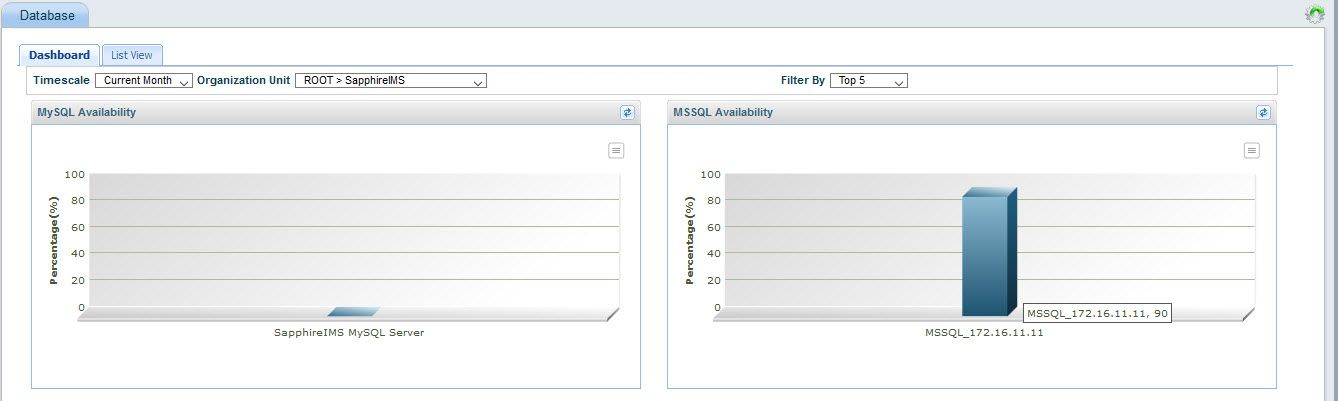
You can select the time period to view the availability as well as filter by Top 2,5 and 10 and Bottom 2,5,10 database instances based on availability. You can also choose to view database instances in a specific Organization Unit by applying the filter.
Click on the particular database instance in the chart to view further details. A new screen is displayed which gives details about the Database instance, its availability in the selected period, the alarms associated with the database, and metrices which are specific to each database like the connections, locks, tables, CPU usage etc.