![]()
![]()
SapphireIMS supports Application Performance monitoring for various applications including Databases, Microsoft Exchange Server, Active Directory, Web Servers and virtual machine servers. For each type of application, a predefined set of parameters are monitored.
To configure applications for performance monitoring, go to 'Settings > Business Service Monitoring > Application Performance'. For more information refer to the topic Settings->Business Service Monitoring->Application Performance.
On the SapphireIMS menu, point to 'Performance' and click 'Applications'. The List View is displayed for the applications configured for performance monitoring as shown below.
The split of alarms as Info, Warning and Critical is displayed along with the counts. Clicking on any alarm indicator, causes the Alarm List View to be displayed in a pop-up containing the alarm details.
Click the application name to view the details for the particular application along with generated alarms.
Click the Customize icon'![]() ' to customize the List
View display.
' to customize the List
View display.
For Hyper V server monitoring, the RAM and VM utilisation parameters are collected. Support is also provided to collect VM availability and threshold parameters for VMWare and Hyper V.
The following Parameters are supported in Active Directory Application Health Monitoring:
1. Total Number of Users
2. Total Number of Computers
3. Total Number of Organization Units
4. Total Number of Security Groups
5. Total Number of Active users
6. Total Number of Disabled accounts
7. Number of users successfully authenticated
The screen below shows the parameters displayed for Exchange server 2013. You can click on individual tabs to view the individual performance parameters.
Click 'Dashboard' to view the dashboard for the applications as shown below.
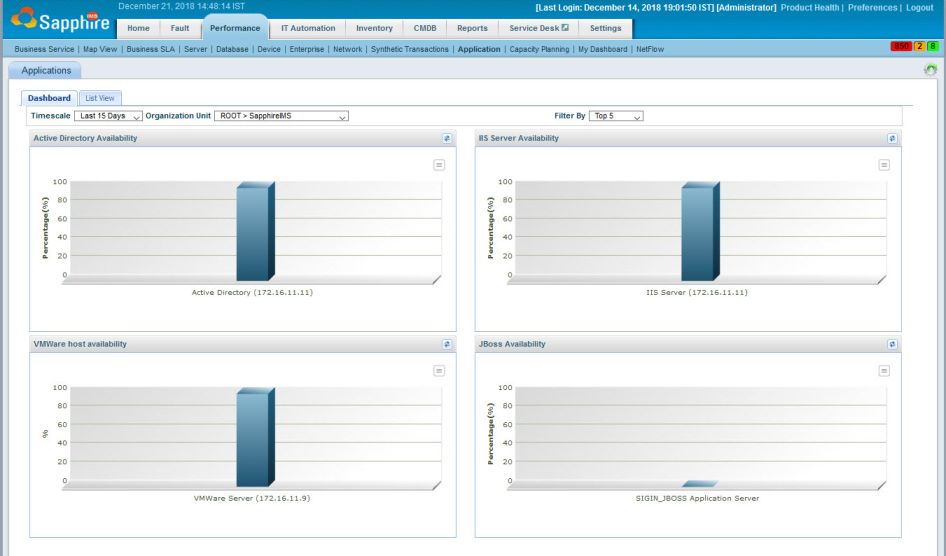
Select the 'Timescale' filter which can be a fixed period or a custom time where you can specify the From and To dates.
Select the 'Organization Unit' to filter data only for a specific OU.
Select the 'Filter by' to get the dashboard view for one of either Top 2, 5 or 10 or Bottom 2,5 or 10 application instances.
Click an application to view the detailed resource information. Click here to refer to the image.