![]()
![]()
This section explains how to configure the settings for Netflow.
Click the 'Settings' tab. In the 'Fault and Notifications' section, click 'Traffic Monitoring'.
In the left hand panel, click on 'NetFlow' if not already selected. This screen allows you to enable the nodes for Netflow monitoring
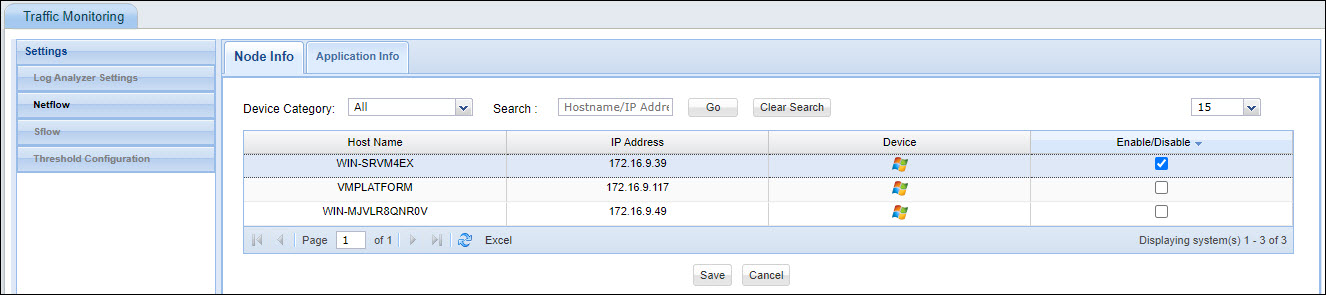
Select the device based on the category or search for the device based on host name/IP Address.
Select the devices to be enabled for Netflow monitoring and click 'Save'.
Next you can add the application information including port and description which will be used in the charts and reports.
Click on the tab 'Application Info'. The listing of all of the standard ports and the applications using them is displayed. For the pre-populated port information, the type is displayed as Built-in.
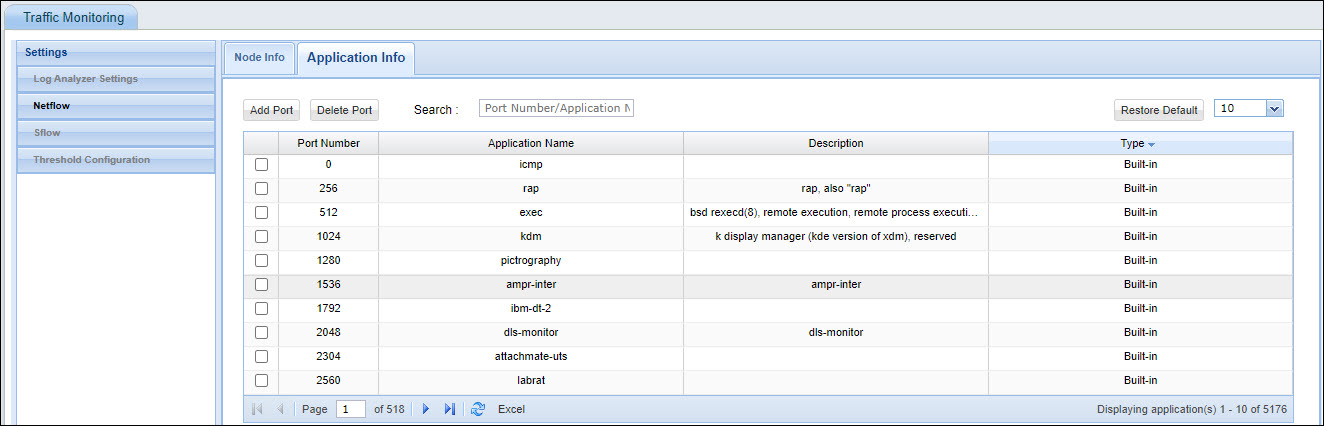
Click on 'Add' if you want to add a new application for which the traffic has to be monitored.
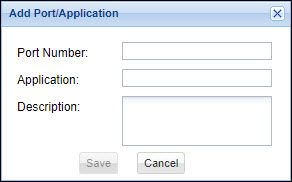
Enter the 'Port Number' used by the application, the 'Application' name and the 'Description'. Click on 'Save'.
The application gets added as User defined type.
To remove an application from the list, select the application and click on 'Delete Port'.
Thresholds can be configured such that if the threshold is breached, alarms can be raised and a service desk record generated for the engineer to resolve.
In the Traffic Monitoring Settings panel on the left hand side, click on 'Threshold Configuration'.
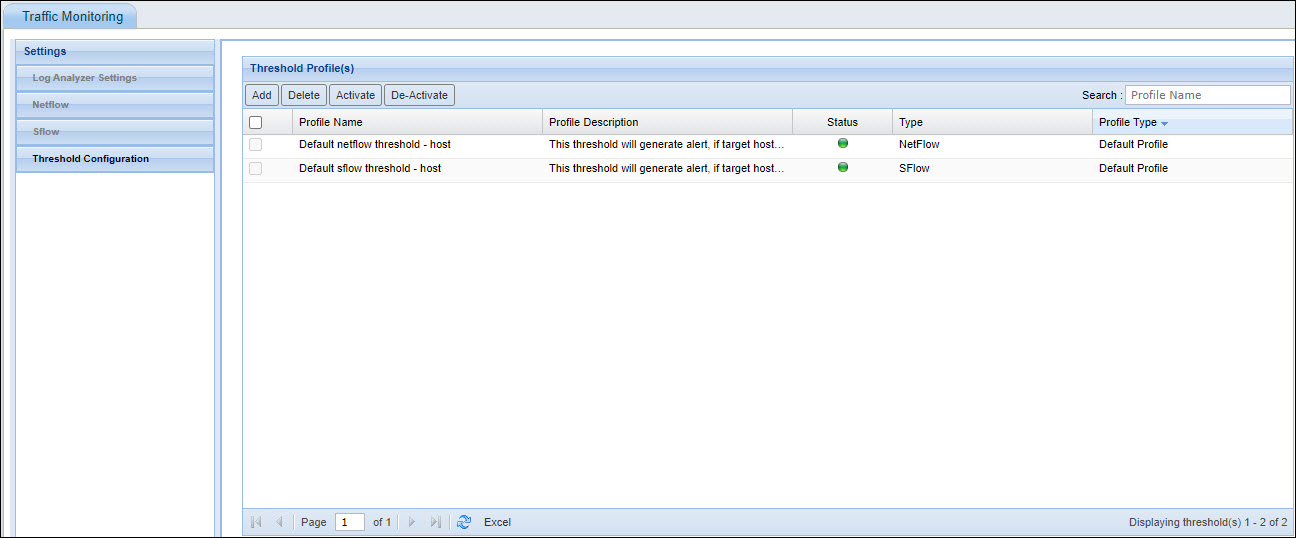
This screen displays the default Netflow and sFlow thresholds that are configured. Click 'Add' to configure user defined thresholds.

Enter the threshold 'Profile Name' and 'Profile Description'.
Select the 'Type', and the 'Hosts' from which alerts are to be received and the 'Alert Criteria' option. The alerts could be based on only the incoming or outgoing traffic or both.
In addition to the host filter, you can select additional filters to be applied on the hosts. Click 'Choose Filter' to add a filter for the threshold. You can filter packets based on Port and IP address.
Enter the 'Port' number, select the 'IP Type' option and enter the relevant IP address information.
Click on 'Define Thresholds' to provide the threshold information.
Select the threshold criteria and enter the relevant information. 'Speed' refers to the speed of data transfer in bytes per second.
Enter 'Tolerance Count'. This refers to the tolerance for subsequent breach of threshold.
Enter 'Duration to consider'. This refers to the poll interval of net flow data collection.
Select 'Severity' from the drop down.
Select 'Macro' to appear in the 'Threshold Template'. The template is used to send the alert message that is displayed on breach of the threshold. Macros which are selected are included in the template and will be substituted with actual values when the message is sent.
Check 'Notify To' box and select the notification rule that is configured. The alert message is sent to all the users defined in the notification rule.
Check 'Generate Ticket' and select the profile configured for converting the alarm to a service desk ticket. Refer to Settings->Fault and Notifications->Alarm to Record for details on creating profiles.
Click 'Save' to save the threshold configuration.
You can activate or de-activate any threshold monitoring by selecting the threshold and clicking on 'Activate' or 'De-Activate'.