![]()
![]()
This section explains how to configure the settings for sFlow.
Click the 'Settings' tab. In the 'Fault and Notifications' section, click 'Traffic Monitoring'.
In the left hand panel, click on 'sFlow'. This screen allows you to enable the nodes for sFlow monitoring.
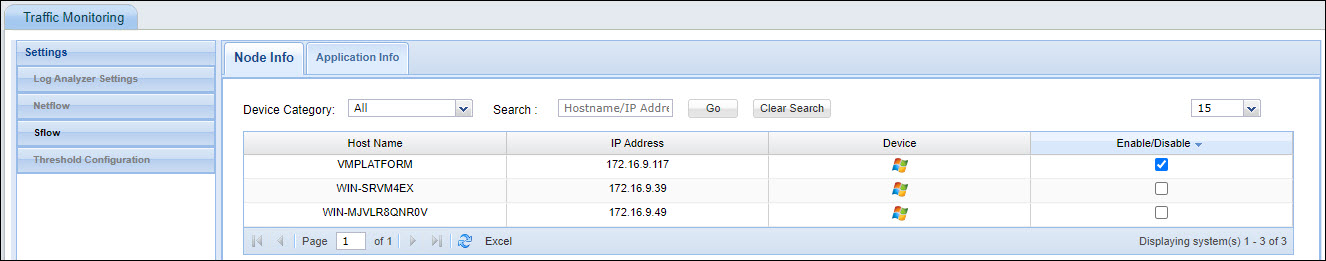
Select the device based on the category or search for the device based on host name/IP Address.
Select the devices to be enabled for sFlow monitoring and click 'Save'.
Next you can add the application information including port and description which will be used in the charts and reports.
Click on the tab 'Application Info'. The listing of all of the standard ports and the applications using them is displayed. For the pre-populated port information, the type is displayed as Built-in.
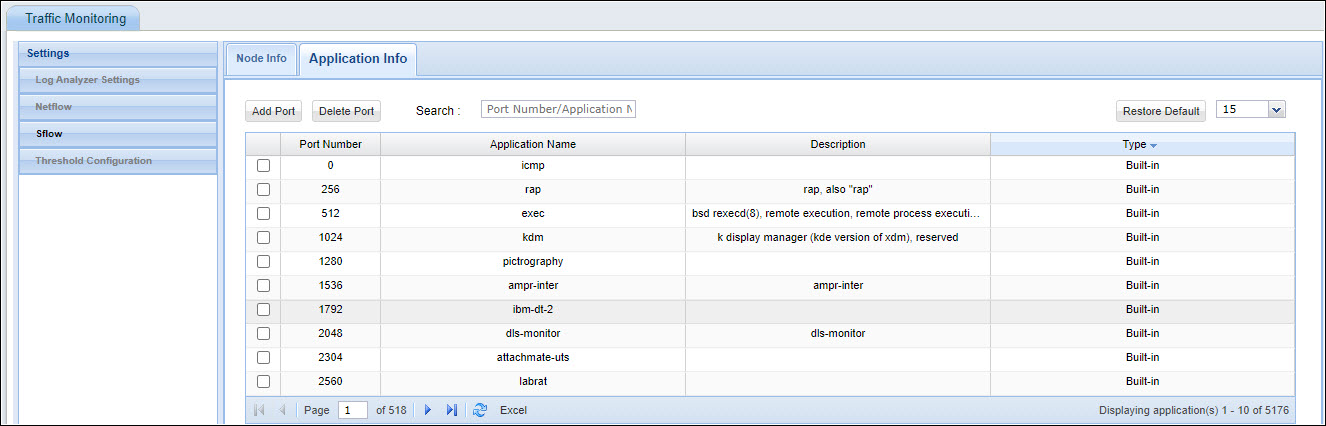
Click on 'Add' if you want to add a new application for which the traffic has to be monitored.
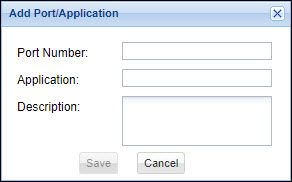
Enter the 'Port Number' used by the application, the 'Application' name and the 'Description'. Click on 'Save'.
The application gets added as User defined type.
To remove an application from the list, select the application and click on 'Delete Port'.
To set the threshold for alarms, refer to Settings->Fault and Notifications->Traffic Monitoring->Netflow->Threshold Configuration.