![]()
![]()
SapphireIMS helps you to view the software metering statistics for the software metering profiles configured under Settings > Asset and Inventory Management > Software Metering
On the SapphireIMS menu, point to 'Inventory' and click 'Software Metering'
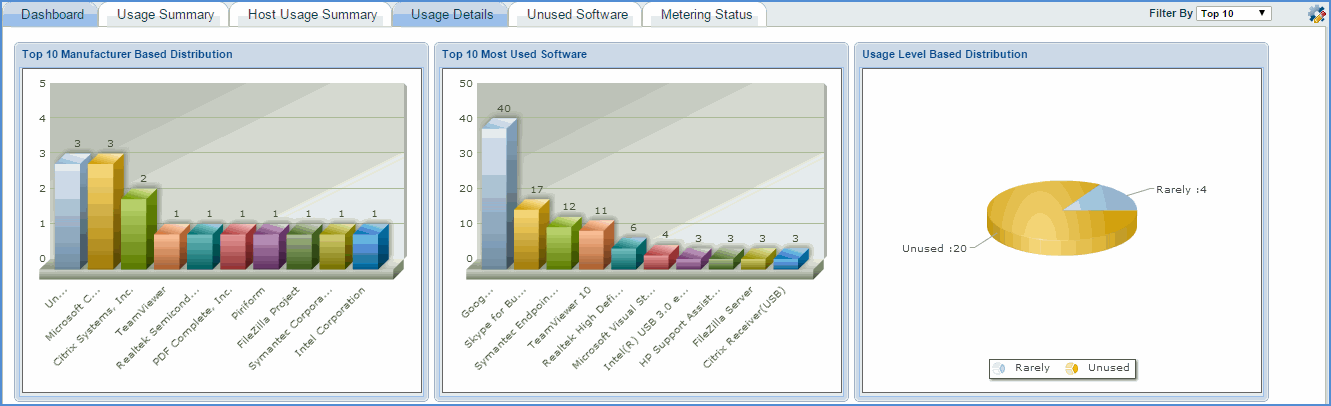
The dashboards provided for software metering are:
Top n Manufacturer Based Distribution : Displays the software used by a particular manufacturer
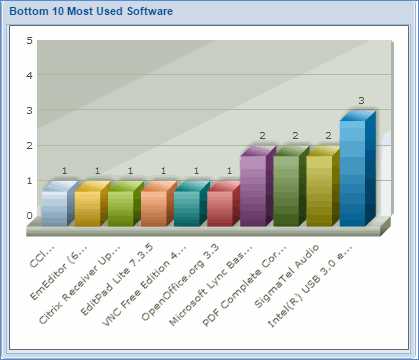
Top n Most Used Software: Most used software is calculated based on how frequently a particular software is used. Similarly, you can get information about least used software by selecting Filter by -> Bottom 10
Usage Level Based Distribution: This dashboard displays the frequently used, occasionally used, rarely used and unused software. Same software can be classified as rarely used and occasionally used for different machines.
Usage Summary
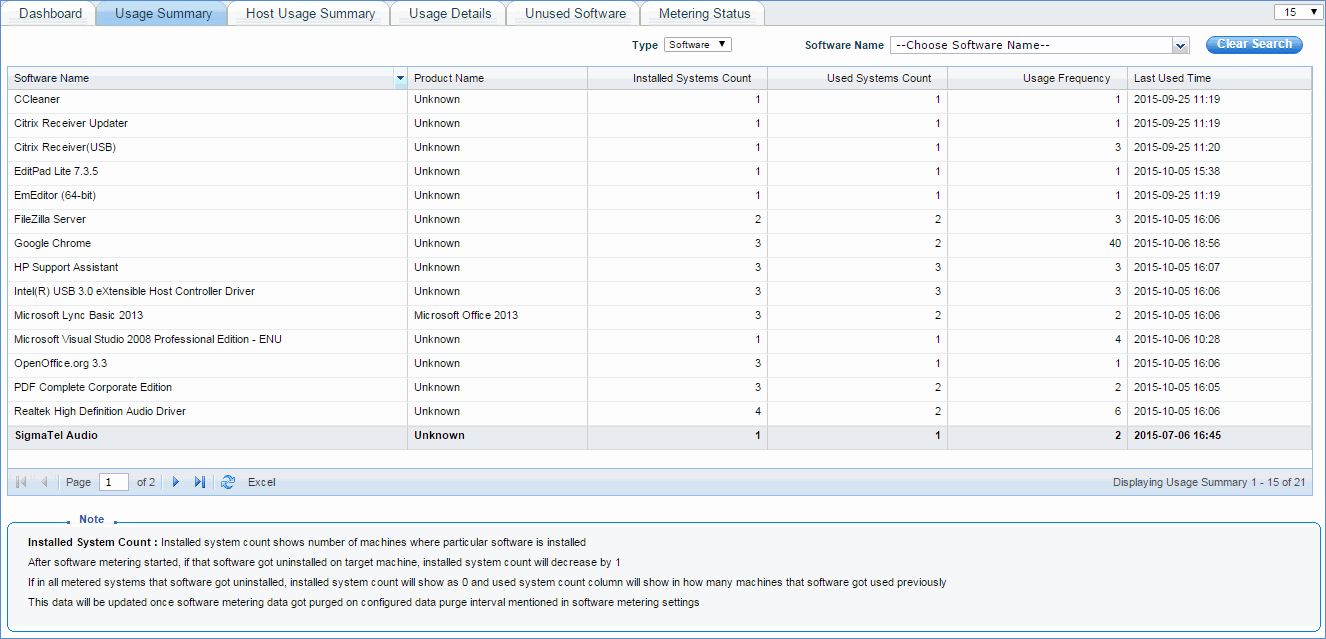
This tab gives the summary of software usage. You can see on how many machines a particular software is installed and in how many machines it is actually used and when it is last used. For unknown software, software name and installed system count will be ‘--‘. If product name property is present, it will be listed in the 'Product Name' column. Here product name is obtained from executable properties and it is not a normalized product that is used in software normalization.
Host Usage Summary
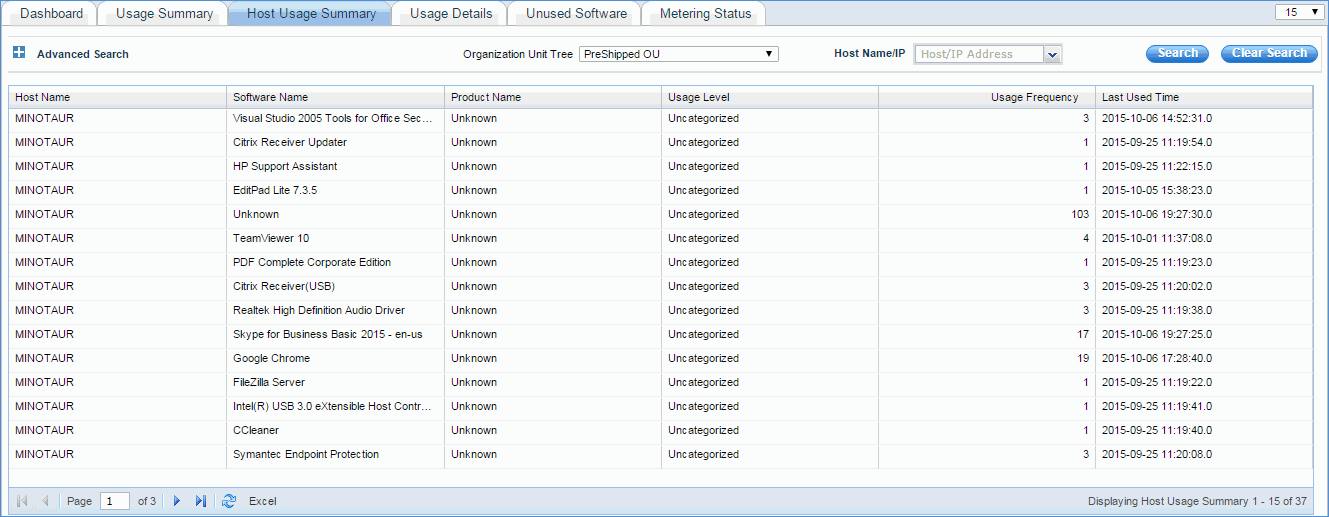
This tab provides summary of software usage host wise and usage level of a particular software on particular host (frequently or rarely or occasionally ). If you want to list only rarely used software, you can use Usage Level filter provided in 'Advanced Search'. This usage level categorization works on software which is used beyond the Sample Period specified in Software Metering Settings. Software which is not used beyond this Sample Period is Uncategorized.
Usage Details
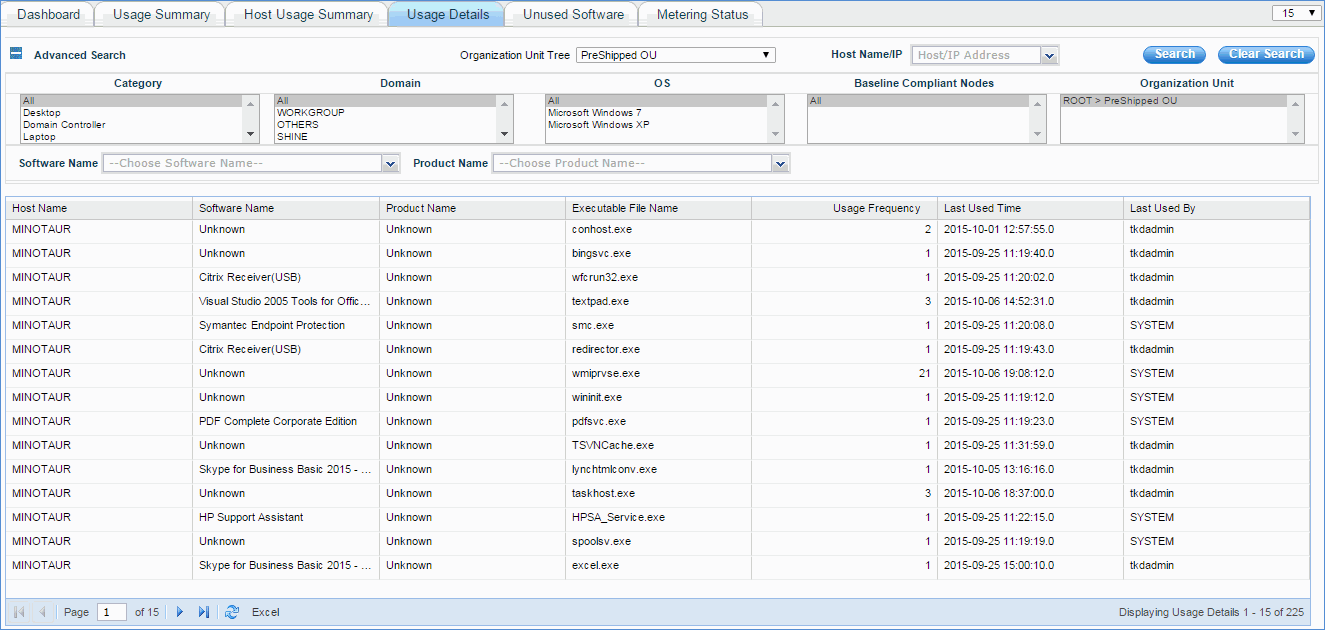
Here, software to executable break up is given. In a particular host, for a particular software information such as how many executables are present and which one is getting used can be obtained from this tab.
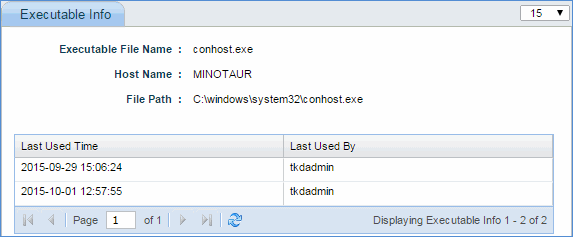
On click of particular executable name, you can see history of usage of that executable in a pop-up as shown below.
Unused Software
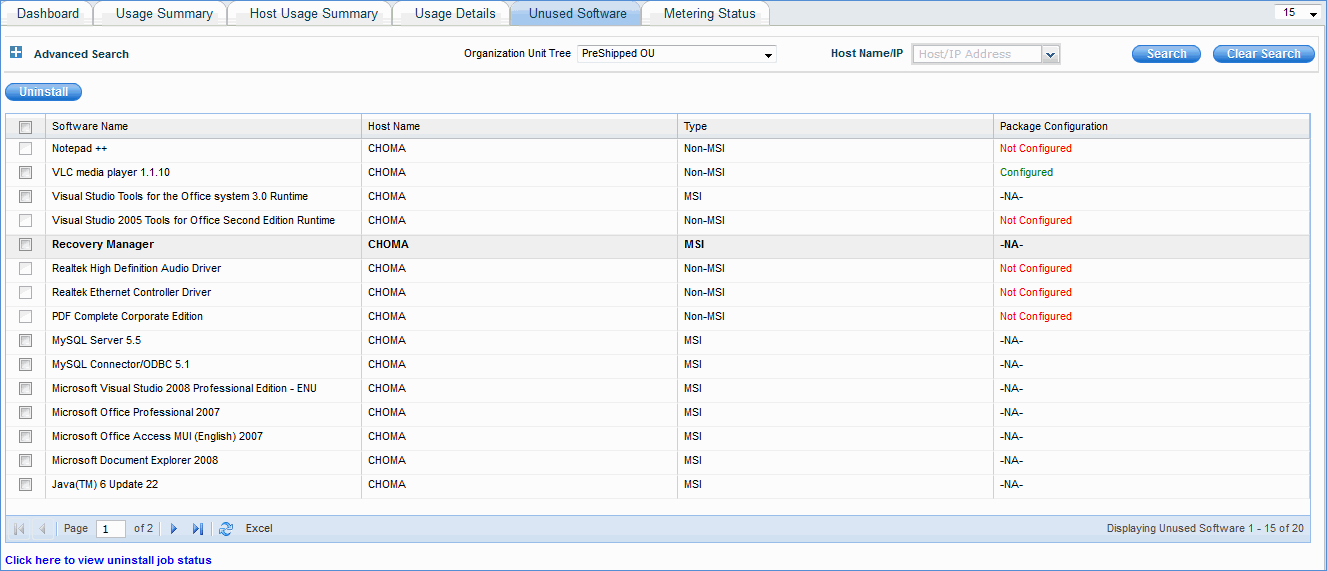
This tab gives software which are unused and waiting for uninstallation. Here you can configure uninstall package for a particular software if it is not configured. For MSI package configuration, the column is not applicable because MSI software are uninstalled through WMI and it does not require silent parameter. Once the package is configured, you can select number of software in the host and click uninstall. The uninstallation job is posted for the corresponding machine with corresponding software. Status of uninstallation job can be viewed under IT Automation -> Automation Tasks -> Automation Task Status.
Here if the job is posted through automatic un-installation, the job name is SM_AutoUninstall_MSI_<time> for MSI software and SM_AutoUninstall_<SofwareName>_<version>_<time> for Non-MSI software.
If the job is posted from UI, job name will be SM_Uninstall_MSI_<time> for MSI software and SM_Uninstall_<SofwareName>_<version>_<time> for Non-MSI software.
Package Configuration
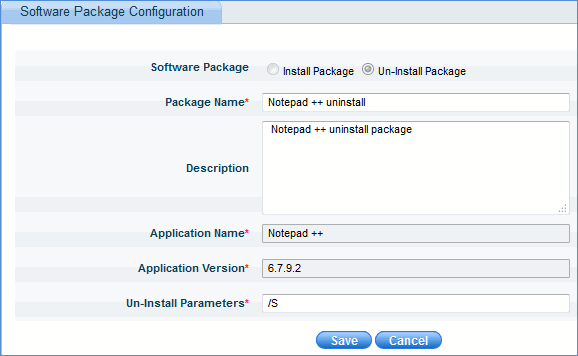
For entries with package configuration that are not configured, click 'Not Configured' to configure the package. Package configuration is similar to configuring uninstallation package in Settings -> Software Management -> Package and Policy Management -> Create uninstall package. You need to give the silent parameter to uninstall the software, otherwise uninstallation will not happen.
Metering Status
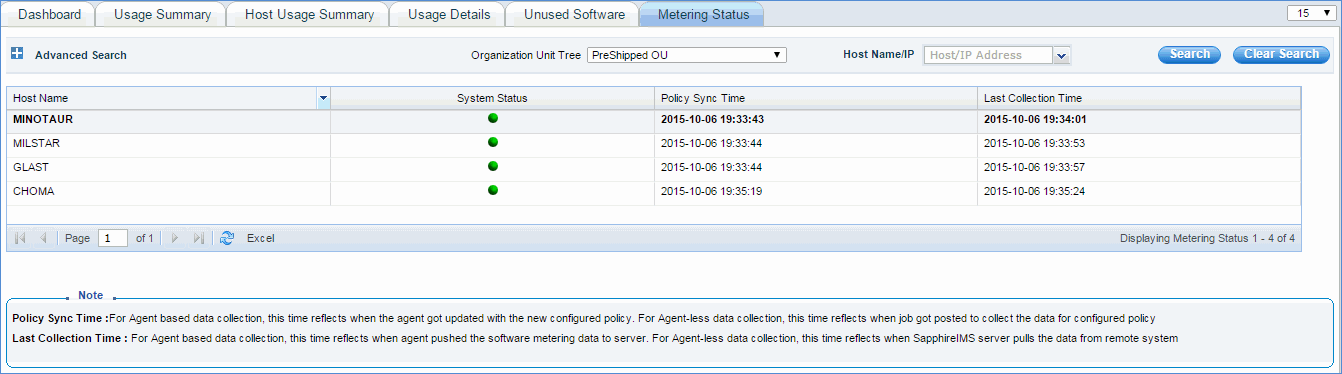
Here you can see the software metering sync time on each machine when software metering data is collected for each host.
Policy Sync Time : Policy sync time in agent-less machines refers to the time when the last software metering collection attempt was made. In agent it refers to the time when the software metering policy was last applied.
Last collection time : The time at which successful software metering data collection happened on each host.