Alarm Management


All the resources that are monitored through Sapphire get polled regularly. Whenever the poll values are collected, they are checked against the threshold rules defined. If there is any threshold breach then an alarm is generated. This section explains in detail how to manage such alarms.

To view alarms follow the steps below

1. Click 'Fault' menu and click 'Alarms'. Each dash board view provides alarms under various categories. This is described in the table below.

alarm_count.gif

Alarm_Dashboard.gif

Alarm View

  Sr. No

Field Name

Description

     1

Filter By

Displays the list of filtering options. By default the dash board is generated for the Top 5 condition. If a filter option is selected (for e.g. Top 2) then the dash board gets regenerated.

     2

Time Scale

By default the time scale is Last 3 hours. If other time scale options are selected from the list box, then the dash board gets regenerated with the selected time scale.

     3

From

Select a custom time From

     4

To

Select a custom time To

     5

Ok

Regenerates the dash board with the selected from to time scale

     6

Top n Hosts generating  alarms

Lists the top n hosts that are in alarm state for the selected time period and filter by condition

     7

Top n recent alarms for system status

Lists the top n alarms for the selected time period and filter by condition

     8

Top n recent alarms for system monitor

Lists the top n alarms related to system monitor that includes Disk/ CPU/ Memory/ Interface/ Paging/ Disk IO  for the selected time period and filter by condition

     9

Top n recent alarms for application monitor

Lists the top n alarms related to application monitor that includes MySQL/ MSSQL/ Oracle/ Active Directory/ Exchange Server/ IIS for the selected time period and filter by condition

    10

Top n recent alarms for service monitor

Lists the top n alarms related to service monitor that includes HTTP/ Mail/ FTP for the selected time period and filter by condition

    11

Top n recent alarms for log analyzers

Lists the top n alarms related to system logs that are getting collected that includes Event Logs/ SNMP Traps/ Syslogs and Change Logs for the selected time period and filter by condition

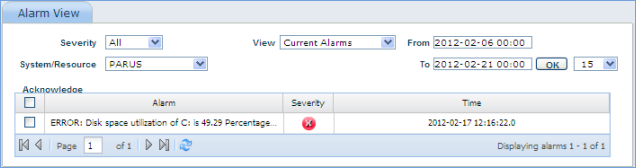
2. To  get the details of the alarms click any of the charts. This will display 'Alarm View' window with the alarm details. Use the filters effectively to see all the alarms.

Alarm_View.png

Alarm Details

    Sr. No

      Field Name

Description

      1

      Severity

Default filter value is All. If this is changed, the alarms are filtered based on the option selected.

      2

        From

Select the From time period. The default time period displayed would be based on the time scale selected in the main dash board screen.

      3

          To

Select the To time period. The default time period displayed would be based on the time scale selected in the main dash board screen.

      4

          Ok

Click OK button to refresh the alarm listing screen based on the time period selected.

      5

           View

By default the filter is set to Current Alarms and all active current alarms are displayed.

If this is set to Acknowledged Alarms, then the dash board displays the acknowledged alarms.

      6

        System/Resource

By default it will display alarms from all systems and resources. Select specific system/resource to display the related alarms.

       7

          Check All

Selects all the alarms displayed in the screen

       8

           Clear All

De-selects all the alarms displayed in the screen

       9

          Acknowledge

Allows users to acknowledge the selected alarms. Once the alarms are acknowledged, then they are removed from the Current alarms status and move into the Acknowledged status.


Alarm Count:

The alarm count of current alarms is displayed in Performance, Fault and Reports tabs.

The color code for the three alarms is:

1) Information alert - Green

2) Warning - Orange

3) Error - Red


Note.gif Note: System Monitor/ Application Monitor/ Service Monitor specific alarms, gets auto acknowledged whenever a positive state is restored. For instance when there is an alarm generated for mySQL Availability, it gets auto acknowledged whenever a positive state occurs for the same (whenever mySQL becomes available in this case)Whenever consecutive alarm option is set (option set in the threshold rules), all the alarms gets acknowledged whenever the positive state happens.


[ Home | Top of page | Previous Page | Next Page ]