![]()
![]()
Business Service Monitoring (BSM) allows you to model and monitor infrastructure
resources as a business service instead of as individual components, measure
overall health of the business service and configure thresholds to generate
alerts when the health of the service falls below pre-defined thresholds.
Rules for Business services monitoring need to be defined. Refer to the topic Settings->Business Service Monitoring->Business Service for more details on defining Business Services for monitoring.
The Business Service rule specifies the individual resources which make up the service. The resources could refer to applications (MS Exchange server, Jboss, IBM Raid, Oracle, MySQL, Tomcat, VMWare etc.) a configured business rule, nodes enabled for performance monitoring, nodes enabled for process monitoring, pollers like DNS, email, FTP, HTTP etc, and nodes monitored for availability. Availability indicates the duration (as a percentage) of when the service is up and running in a given time period. Health is computed based on a defined rule. The rule can be made up of various parameters of the infrastructure resources with threshold limits set against each and weightages associated with each of the parameters.
To view the business service performance on the SapphireIMS menu, point to 'Performance' and click ‘Business Service’. The list view of the Business Services is displayed.
Click on 'Performance > Business Service'.
Under 'Business Service Management' tab, click on 'List View'
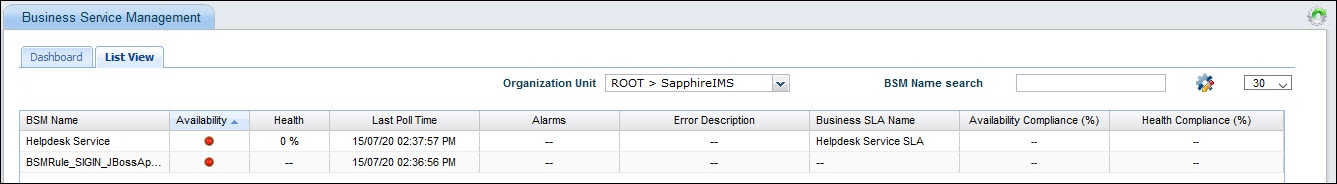
Select an 'Organization Unit' to filter the search. You can also search for a specific device by BSM Name.
The 'List View' displays the Business Services configured for performance along with the Availability, Health and other parameters. Click on the 'Alarms' column to view the alarm description in detail.
The split of alarms as Info, Warning and Critical is displayed along with the counts. Clicking on any alarm indicator, causes the Alarm List View to be displayed in a pop-up containing the alarm details.
Click on the service to view 'Availability' and 'Health' of the service in detail.
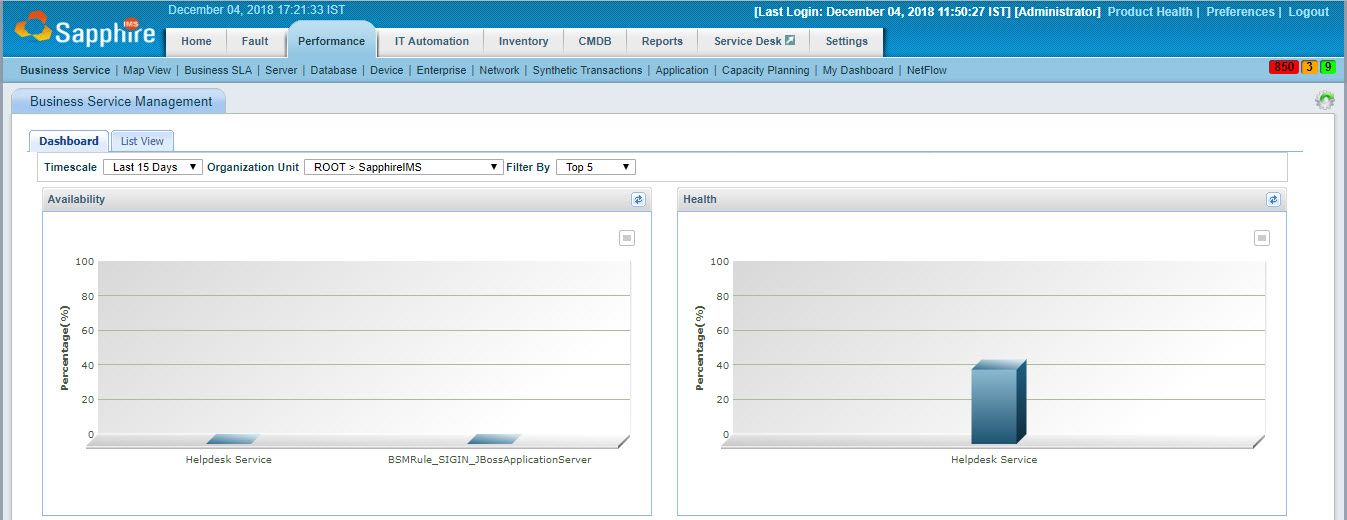
The dashboard displays the graph of all the services configured in the 'Business Service' section under 'Settings > Business Service Monitoring'. There are 4 graphs which show the Availability, Health and the compliance status with respect to SLA for Availability and Health (Refer the topic Business SLA for more information).
Note: 'Business Service' tab will be visible if the logged in user has access to view business service.
On clicking any service on the graph, a detailed view of the service is displayed on a separate screen including the Availability and Health graphs, Alarms, Dependant Resource Status and Dependent Resource Availability/ Dependent Resource Health.
Click on the topics below to view the detailed screens for the service.
In the screen which gives the detailed view of the service, you can click the 'Actions' drop down to perform the following actions
'Resource Config' - Click this to open the Business Service configuration screen.
'Ping' - Click this to open the Ping configuration screen through which a 'ping' request can be sent to any host and the response seen.
'Traceroute' - Click this to open the Traceroute configuration screen through which the 'traceroute' command can be executed to any host and the route traced.
'SNMP Walk' - Click this to open the SNMP Walk configuration screen through which the SNMP walk.
Thresholds can be set for the Availability and Health separately and for the dependent resources for each service as well. Follow the steps below to set a threshold.
1. Click on the sign ‘![]() ’ in the ‘Availability’ and in the ‘Health’ section
to set an alarm for the Business Service. Please refer Thresholds
to define thresholds for generating alarms.
’ in the ‘Availability’ and in the ‘Health’ section
to set an alarm for the Business Service. Please refer Thresholds
to define thresholds for generating alarms.
2. Click on the sign ‘![]() ’ in the ‘Dependent Resource Availability’ section to
set an alarm for the dependent resource. Enter the threshold details.
Please refer Thresholds
to define thresholds for generating alarms.
’ in the ‘Dependent Resource Availability’ section to
set an alarm for the dependent resource. Enter the threshold details.
Please refer Thresholds
to define thresholds for generating alarms.
3. When this threshold is breached, an alarm will be generated and will be displayed in the alarm section.