![]()
![]()
Business service monitoring helps customers to keep a watch of mission critical service delivery infrastructure and manage it to avoid any interruptions in services offered to the business.
One of the critical elements of monitoring is events/alarms. The fault management module deals mainly with configuring alarm thresholds, generating alarms and taking necessary action in case of a threshold breach. Threshold breach occurs if the current monitored value lies out of bounds of the specified range of the threshold. Alarm thresholds can be configured globally which would then apply to all the devices or for individual parameters through the provided dashboards.
The fault Management system generates alarms of different severity levels. Notification Profiles help you to create a profile to notify appropriate users/managers for a quick resolution of the problem.
Thresholds are the key parameters which help to classify a collected monitoring parameter to be in alarm state or not. Thresholds can be defined for any of the following collected parameter:
Performance Monitors
Application Monitors
Service Monitors
Process Availability
Service Availability
System Status
Click on the below topics to view it in detail
Click the 'Settings' tab. In the 'Fault and Notifications' section, click 'Thresholds'.The list of global thresholds defined in the system is listed.
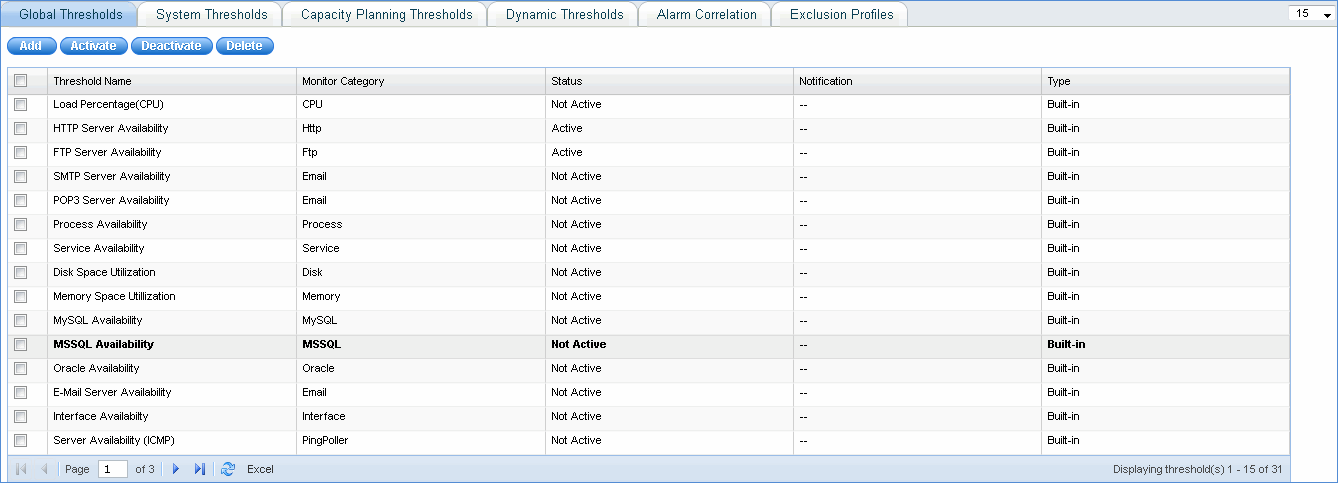
Add: Click here to define thresholds. If you try to define a parameter for which a global threshold already exists, then the defined values are populated and you can edit the same.
Activate: Select a threshold and click this button to activate the built-in threshold.
Deactivate: Select a threshold and click this button to de-activate the built -in threshold.
Delete: Select a threshold and click this button to delete the threshold definition from the system
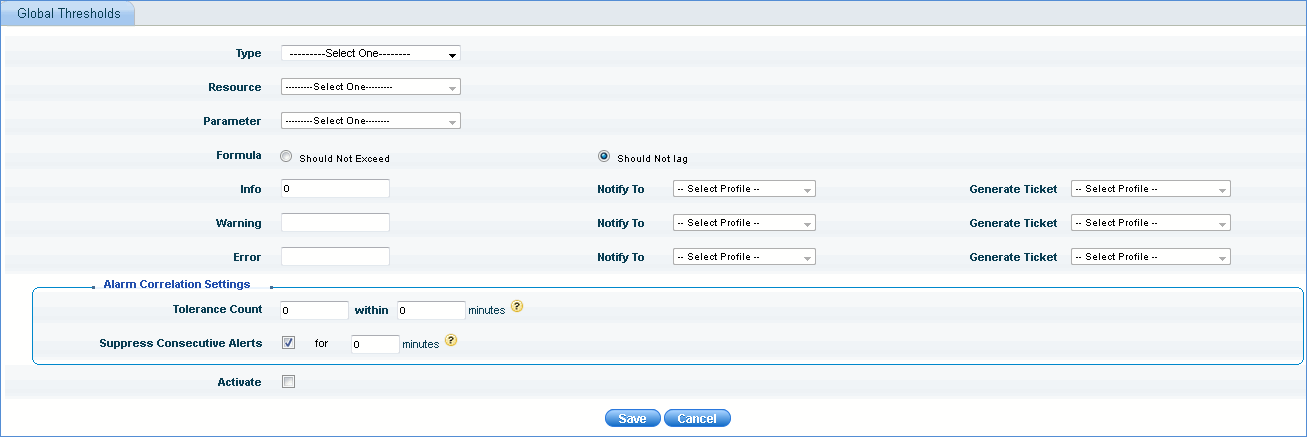
To define a new threshold click 'Add'.
|
The System thresholds tab provides the list of thresholds defined for the system resources and the notifications generated against them. There are two types of system thresholds, instance level and system level thresholds.
1. Instance Level Threshold
When a threshold is configured for an instance of the device, the threshold is termed as an instance level threshold. The following example shows how to configure an instance level threshold.
1. Click Performance > Enterprise List View> Desktop
2. Click List View and click a particular node
3. Click 'Disk' and in the 'Instances' drop down, select 'C:'
4. Click the threshold
icon ' '
for disk space utilization
5. Configure the threshold as shown below and click 'Save'
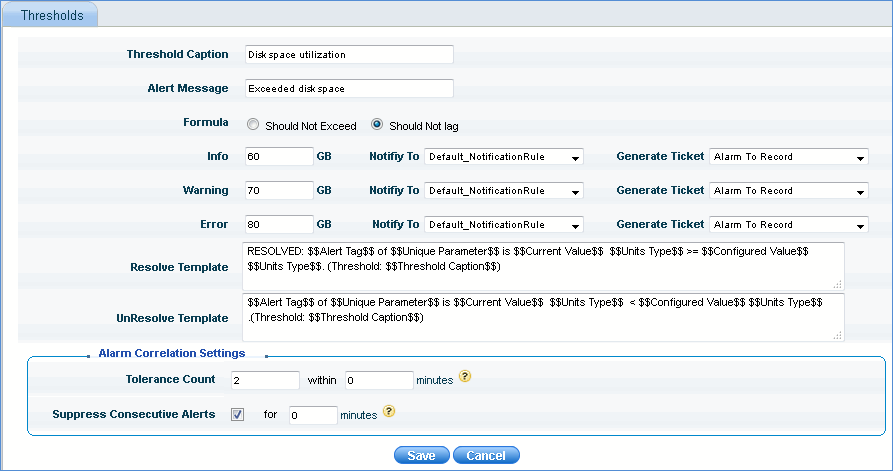
Notes: Tolerance Count - Specify tolerance count if any to discount occasional irrelevant spikes in the monitored parameter to be classified as an alarm. No alarm would be generated if the breaches happen within the tolerance count range. 0 minute represents infinite.
Suppress Consecutive Alerts - If any consecutive alarm gets generated within the specified time period, the alarm is suppressed. 0 minute means the suppression of alarms continues for infinite time till the active alarm is resolved.
2. System Level Threshold
When a threshold is configured at the host level or for all instances of the device, the threshold is termed as a system level threshold
1. Click Performance > Enterprise List View> Desktop
2. Click List View and click a particular node
3. Click 'Disk' and in the 'Instances' drop down, select 'All'
4.
Click the threshold icon ' ' for disk space
utilization
5. Configure the threshold and click 'Save'
Notes: 1. Alarms are generated with first priority at instance level and next priority at system and global levels respectively.
2. You can search for a system threshold based on threshold caption, host/resource name, parameter or instance
To view system thresholds configured, click 'Settings'. From 'Fault and Notifications' section, click 'Thresholds'. Click 'System Thresholds'. This screen will list all the system level or instance level thresholds that are currently defined.

Here you can define global thresholds related to capacity planning.
Click the 'Settings' tab. In the 'Fault and Notifications' section, click 'Thresholds'.
Click 'Capacity Planning Thresholds'. All the capacity planning thresholds defined are listed here. Click 'Add' to add the global threshold for capacity planning as shown below.
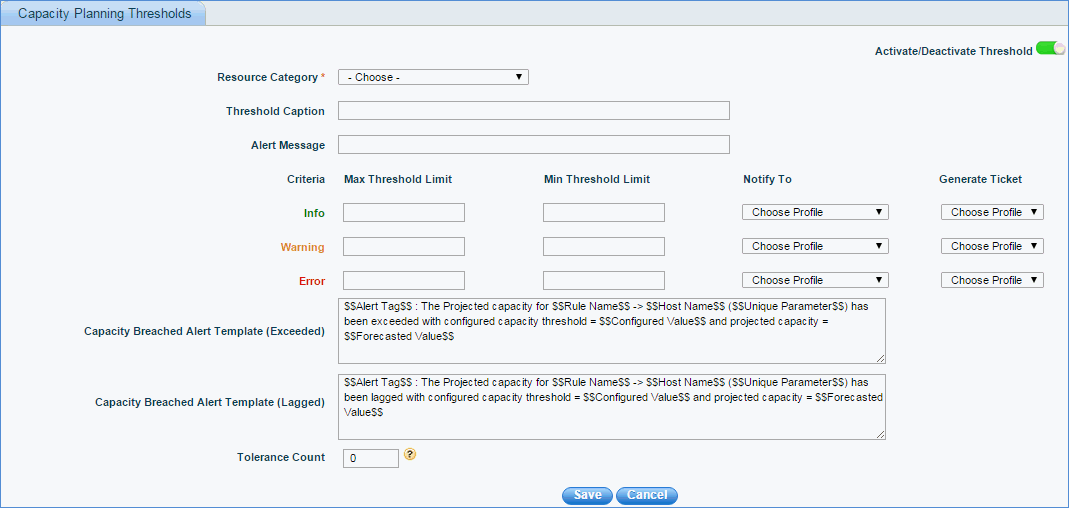
SapphireIMS allows multiple levels of alarms threshold for each of the monitoring parameters to categorize the severity of alarms into Information, Warning or Error. This helps the operator to prioritize and decide on the response and resolution plans.
Though the approach of defining static thresholds to alert when needed is necessary, yet, it is easy to miss subtle changes in behavior when you purely rely on predetermined, static thresholds only. These subtle changes often foreshadow a potential service disruption when detected. Additionally, it has been found that having a static threshold may not take into account business conditions and thus could result in false alarms thereby causing a real disruption to be missed.
Here comes the need of dynamic baseline threshold based on empirical data which correspond to business events and conditions, rather than static thresholds. The system should be able to read the empirical data and adjust its threshold dynamically. This will help improve the performance monitoring alerting mechanism and also eliminate the maintenance overhead to manually evaluate peaks and configuring them for thresholds over a period.
With the threshold baseline variation report, the operator can also get to know the changes that happen with respect to the device and can take proactive measure in resolving them.
Click the 'Settings' tab. In the 'Fault and Notifications' section, click 'Thresholds'. Click 'Dynamic Thresholds'. This screen will list all the dynamic thresholds that are currently defined
Click 'Add' to add a new dynamic threshold
Notes: 1. Static threshold has to be configured for the corresponding performance metric prior to dynamic threshold configuration of the same.
2. Dynamic threshold configuration is applicable for system performance, synthetic transaction monitoring and application monitoring performance metric

Select the resource category for which the dynamic threshold has to be configured.
Select the corresponding device categories
Select the resource type and corresponding resource parameter and click 'Add'. Similarly multiple resource parameters can be selected.
Click 'Next'
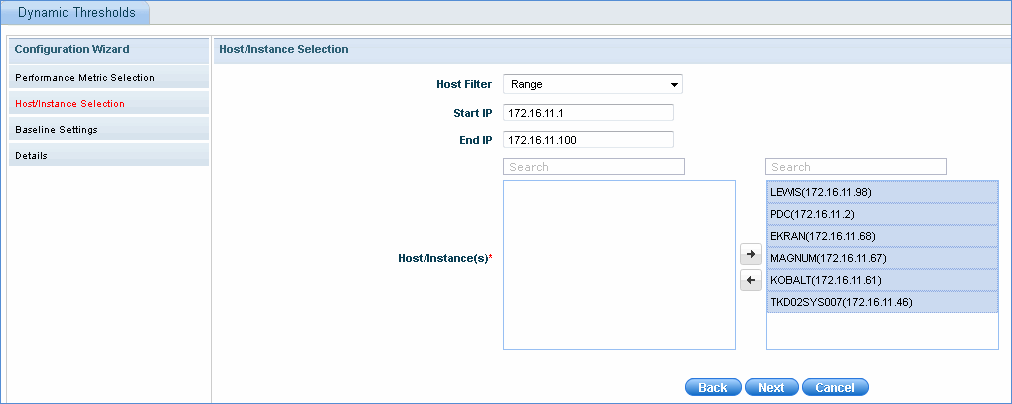
Select the host filter and based on that, select the hosts which have to be configured for dynamic thresholds

Enter the number of days for which the performance data is to be considered before base lining the threshold
Enter the baseline percentage deviation to generate the corresponding severity alarm for the performance metric selected.
Check 'Enable Notification Changes', to get notified when the baseline changes deviates as per the specified days and percentage deviation. Select the notification profile and click 'Next'
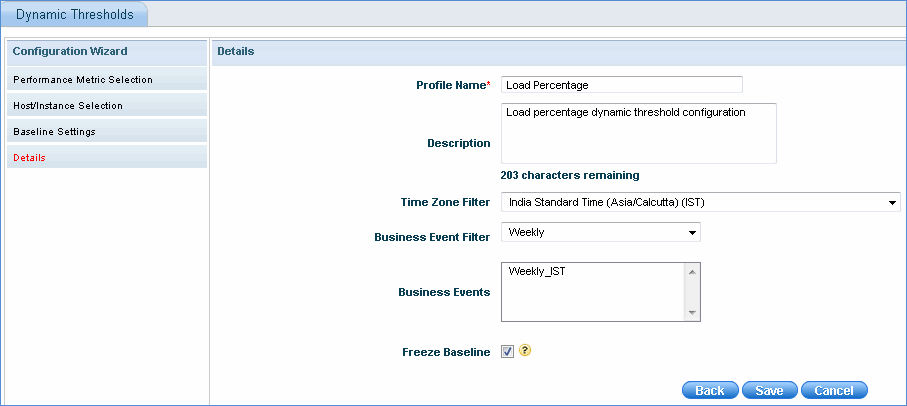
Enter the profile name and description of the dynamic threshold configuration
Select the time zone to be considered for the threshold generation
Select the business event filter and the corresponding business event. The business events listed will be based on the selected 'Time Zone' filter and 'Business Event' filter. The threshold generation will take into consideration the time interval specified in the business event selected.
Check 'Freeze Baseline' to freeze the baseline once it is calculated. There will not be any further baseline calculation performed on this rule until 'Freeze Baseline' option is unchecked.
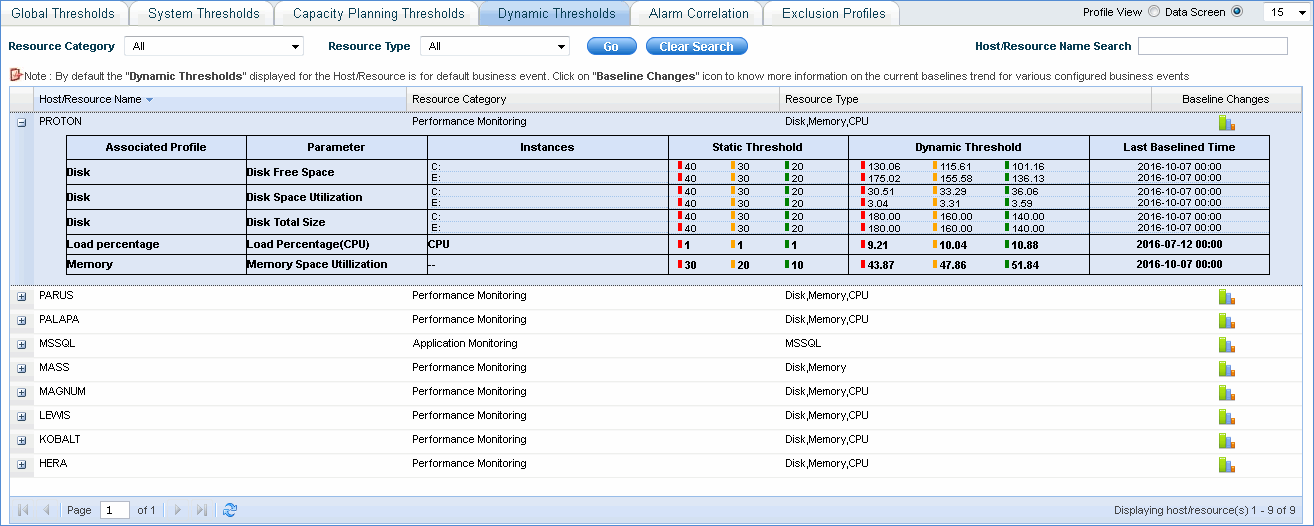
Click 'Save' to save the threshold configuration. Once saved, it will be listed in the screen as shown below along with the baseline status and threshold status.

Check any of the baseline profiles and click 'Freeze Baseline' to freeze the baseline and click 'Unfreeze Baseline' to unfreeze the baseline for the selected rule.
Click 'Data Screen' to view the thresholds for the individual devices or resources
Alarms are of two types:
1. Alarms generated by SapphireIMS monitoring stack based on the threshold breach
2. Alarms/events generated by a third party source and forwarded to SapphireIMS (Standard events which are supported are syslog, snmp traps and event logs)
Key properties of the alarms (internally generated or received from 3rd party and converted into an internal format) are Severity, Description, Creation-time, Current Status, Hostname/Resource(where it occurred).
SapphireIMS allows the customers to subscribe to alarms of interest and get notified through E-mail/SMS OR trigger automatic action OR raise an incident which can be tracked to closure.
Some of the common challenges faced are:
1. Too many non-informative alarms get displayed to the operators and they end-up ignoring critical alarms at times.
2. Customers have stand-by or redundant infrastructure for mission critical services. Key stake-holders are interested in receiving alarms when both the infrastructures are down. Otherwise, they want the alarms to be sent only to the operational teams for routine actions and service restorations.
3. Services are delivered over distributed infrastructure consisting of physical or virtual environments. Customers are interested in monitoring the impact to the service rather than just getting individual component level alarms. i.e. Can the alarms carry a message of service impact rather than only component impact?
4. Customers are interested in being alerted, if the problem persists for a period of time and don’t want to be notified for the transient conditions.
5. Some devices / apps may depict unusual behavior for a moment. For example, CPU spike or packet drops in the internet leased line OR link failure, etc. The devices which perform the task generate an alert instantly (syslog on link flap). Can the alarm monitoring system analyze and generate meaningful alarms, if the problem persists?
All the above challenges commonly bring out the need for intelligently analyzing and operating on the alarms before presenting it to the operators for actions. Alarm correlation as a feature can address the above challenges.
Click the 'Settings' tab. In the 'Fault and Notifications' section, click 'Thresholds'.
Click 'Alarm Correlation'
Generic Rules

These rules can be configured by the user for specific situations when alarms are generated.
1. Enable the correlation for the generic rule to take effect. This allows all the alarms to be displayed in the transient alarm list which are then acted upon by the correlation engine or rule, else all the alarms are displayed in the alarm list view without being passed through the correlation engine.
2. If 'All Pass Filter' is selected, the alarms are not filtered i.e. they are passed through the correlation rule even if they do not match any input filters.
3. If 'No Pass Filter' is selected, then the alarm is dropped in the transient alarm list if the transient alarm is not applicable for any of the configured input alarm filters i.e. if the input alarm does not match any of the correlation rules, default action is selected.
Click 'Add' to add the generic rule
Input Alarm Filter - Here you can qualify the transient alarms which need to be passed through the correlation rule
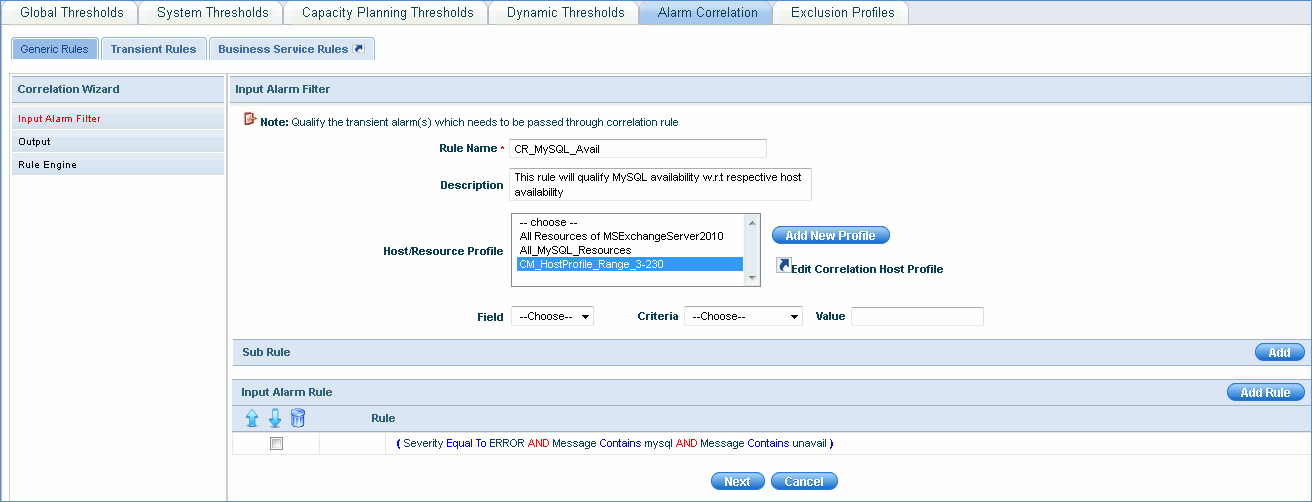
In the above example, all the hosts that belong to the host/resource profile 'CM_HostProfile_Range_3-230' where the alarms generated have severity equal to 'ERROR' and message contains 'mysql' as well as 'unavail' are passed through the alarm correlation rule.
'Add New Profile' takes you to the Profile Manager page where you can add profiles (select hosts/resources) to be used for alarm correlation.
Output
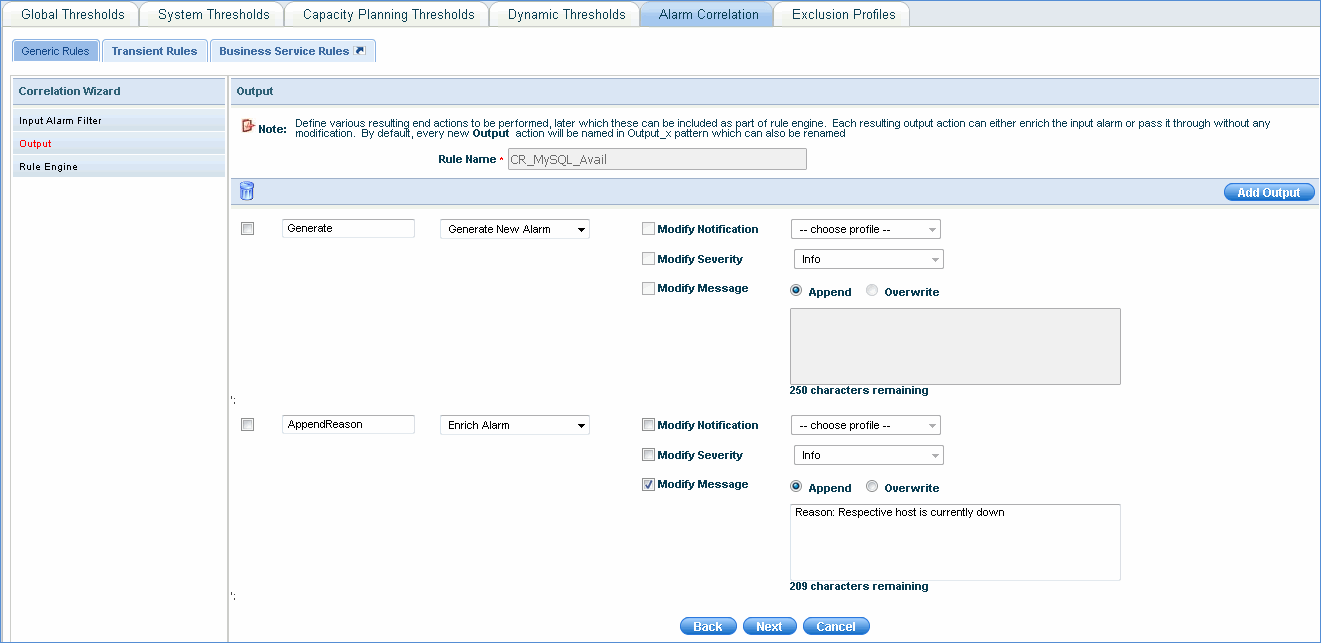
After input filter is applied on the alarm correlation rule, the next step is to define the output or end actions to be performed on the alarms. The output can be generated as a new alarm or the existing alarm can be enriched by modifying the notification, severity or the alarm message.
In the below example, the alarm rule defined above is enriched by appending the reason "Respective host is currently down"
Rule Engine
Alarms have two conditions - Sleep and Check Active Alarm. If an alarm is in Sleep state, macros cannot be applied on it. Within (sec) or the time duration for checking the alarm state is not applicable. Occurrence of the alarm is also not applicable. Only Delay interval (mins) or the duration of the alarm in 'Sleep' state is applicable. 'After Delay' or the next action to be performed after the completion of 'Sleep' state has to be selected. This can be a configured output action or a new state or the alarm can be dropped.
If 'Check Active Alarm' condition is selected, you need to specify the time duration (Within (sec)) for checking the alarm state and occurrence of the alarm state. You can even select macros to filter hosts. (See Conditional Macros) If the alarm is available, select output action or a new state or drop the alarm. Similarly, if the alarm is unavailable, select output action or a new state or drop the alarm.

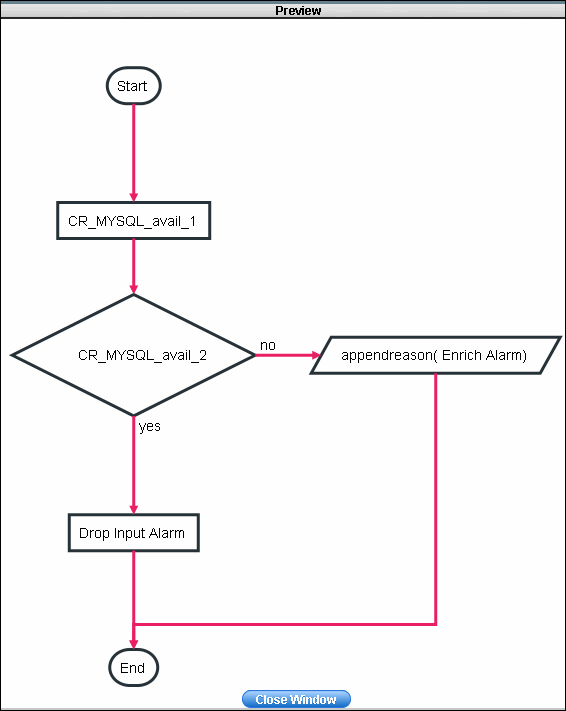
Click on 'Preview' to view the flowchart of the alarm rule engine configuration and click on 'Finish' to save the configuration
You can add conditional macros which can be used in generic rules. Macros help you to select hosts based on the severity or message criteria of the alarms
Click 'Conditional Macros' and click the 'Add' button
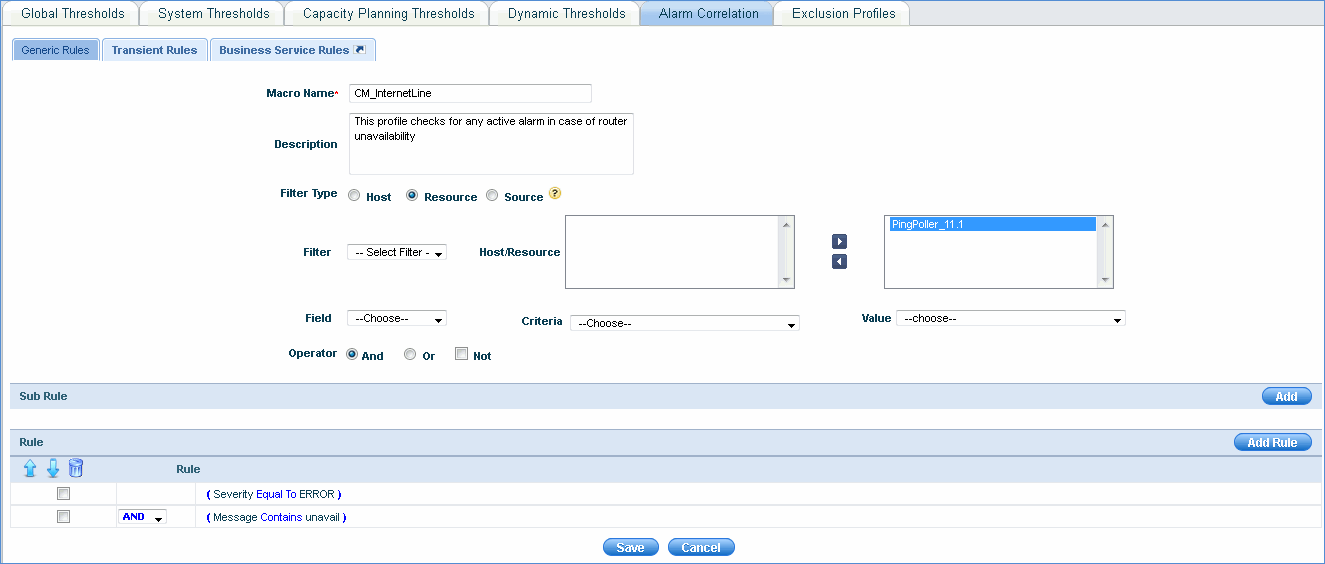
In the above example, the macro checks for active alarms with Severity equal to 'ERROR' and message containing 'unavail' for all resources belonging to the selected profile.
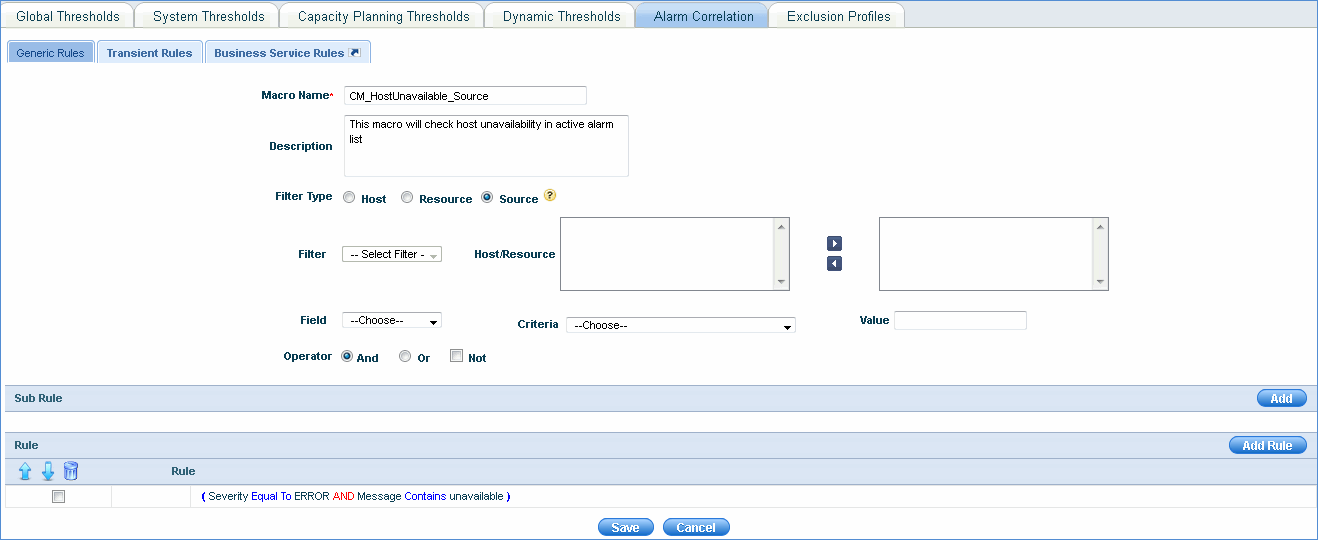
In the above example, the macro checks for the host unavailability in the transient alarm list for the corresponding Field parameters (Severity/Message) that are selected.
Source option means that the correlation rule engine gets the system or resource details from input transient alarms.
Transient Rules
These rules apply to all the active alarms and are added to update the tolerance count and to enable or disable the suppression of consecutive alarms for system or global thresholds.

|
Business Service Rules - You can add business service rules to configure thresholds to generate alarms. See Business Service for more details
Note: For performance monitoring of devices, all built-in thresholds defined and activated will be global and will be applied to all the devices. If you need to define a device specific threshold then refer to 'Types of Thresholds' given below.
Global definitions are allowed only for the Availability statistic for Service Monitor and Application monitor resources. Threshold definition for all other statistics related to these monitors will be supported at the resource level only.
A provision has been provided to exclude global threshold capacity planning for various device categories.
Click the 'Settings' tab. In the 'Fault and Notifications' section, click 'Thresholds'.
Click 'Exclusion Profiles'. Click 'Add' to add the exclusion profile for capacity planning as shown below.

Select the device category and the hosts/resources which will be excluded from capacity planning global thresholds. No alert messages are sent to the excluded devices.