![]()
![]()
This section describes the performance views for devices.
Point to the 'Performance' tab and click 'Device. This view displays the devices and the alarms configured for those devices apart from Vendor, Model and other performance related parameters.
Select an 'Organization Unit' to filter the search. You can also search for a specific device by Host Name.
The split of alarms as Info, Warning and Critical is displayed along with the counts. Clicking on any alarm indicator, causes the Alarm List View to be displayed in a pop-up containing the alarm details.
Click the particular device instance to view further details as shown below.
Click the Customize icon'![]() '
to customize the List View display.
'
to customize the List View display.
Click on the Host Name to view the performance attribute data.
Note: Actions drop down allows you to perform certain actions on the network device. Please refer to Performance > Server for a detailed explanation.
On the SapphireIMS menu, point to 'Performance' and click 'Devices'. Click on 'Dashboard'.
To configure devices for performance monitoring, go to 'Settings > Business Service Monitoring > System Performance'. For details refer to the topic Settings->Business Service Monitoring->System Performance.
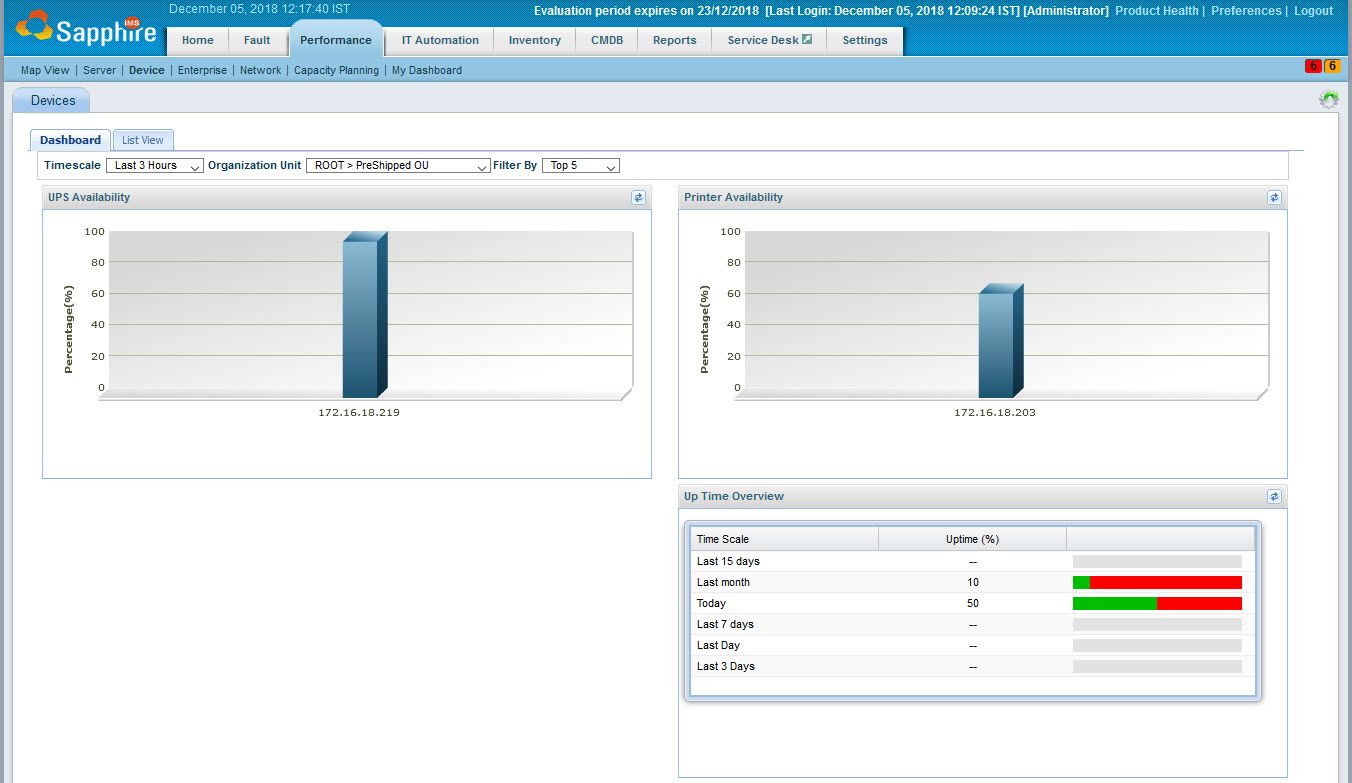
Select the 'Timescale' filter which can be a fixed period or a custom time where you can specify the From and To dates.
Select the 'Organization Unit' to filter data only for a specific OU.
Select the 'Filter by' to get the dashboard view for one of either Top 2, 5 or 10 or Bottom 2,5 or 10 devices.