![]()
![]()
To view the performance data collected for servers on the SapphireIMS menu, point to 'Performance' and click 'Server'. The List Views for the servers is displayed.
'List View' tab displays a list of servers in as tabular view. Clicking on any of the servers in the charts opens up a screen with detailed data about the server (see Server Detailed View below)
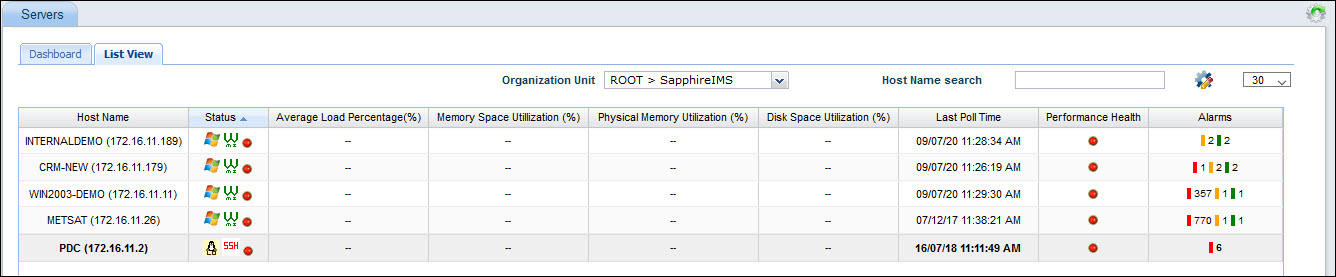
Select an 'Organization Unit' to filter the search. You can also search for a specific device by Host Name.
The split of alarms as Info, Warning and Critical is displayed along with the counts. Clicking on any alarm indicator, causes the Alarm List View to be displayed in a pop-up containing the alarm details.
For allowing speedier action to be take, the servers which are 'down' are listed first.
When you click on the desired host in any of the charts or in the List View, it opens up the detailed view of the server where you can see the data under different tabs which are 'Summary','Disk','Interface','CPU','VM', relevant to that device. The data displayed in each of the tabs is given below.
In the Summary tab you can see the 'Device information', 'CPU Utilization' graph, 'Memory Utilization' graph, 'Disk utilization' graph and the 'Alarms' list

The 'Availability' tab gives the availability over a period of time based on 'ping' responses and the average 'Up-time' in a selected period.
The 'CPU' tab displays the average load over the selected period for all CPUs and the load for a specific CPU.
The 'Disk' tab gives the Disk space, the Utilization, Free and Used Space for the selected drive and in a selected period.
The 'DiskIO' tab gives the IO statistics including Reads and Writes for a selected physical drive in a selected period.
The 'Interface' tab gives the Total traffic on an interface, the incoming and outgoing traffic, current bandwidth, interface availability and utilization for the selected interface in a selected period.
The 'RAM' tab gives details of total physical memory, free memory and utilization in a selected time period.
The 'VM' tab gives details of total virtual memory, free memory and utilization in a selected time period.
The 'Paging' tab provides the paging statistics including Utilization, Paging Free Space and Page Size in a selected time period.
The 'Process' tab gives details of the virtual memory used and the availability of the selected process in a specified time period.
The 'Service' tab gives the availability of service instances on the server in a selected time period.
The 'Dynamic Thresholds' tab displays the performance parameters for which dynamic threshold has been enabled.
The 'SMART' tab displays the S.M.A.R.T (Self-Monitoring, Analysis and Reporting Technology) attributes if the disk drives in the server are enabled for S.M.A.R.T monitoring. Refer to the topic on S.M.A.R.T for more details.
In each of the tabs, you can click ‘![]() ’ sign to refresh the chart.
’ sign to refresh the chart.
There is an 'Actions' drop down at the top right corner of the screen that lists the possible actions that can be performed on that server (refer to the figure above).
Unmanage: Select this option if you want to unmanage the node. This can be done if the data collection is no longer required for the server.
Delete: Select this option if data collection and monitoring is not required for the respective node/device. Later if the data collection and monitoring has to be re-enabled, the node will have to be rediscovered.
Data Collection type: Once a device is discovered and classified as ‘Managed’ it will be associated with a data collection type and a credential profile. However, if this needs to be changed then perform the following steps.
By default it will display the current ‘data collection type’ and the ‘profile’ that’s tagged to the device. Override this by selecting the data collection type and profile of your choice. Click 'Update'
The server will be tagged with the selected data collection type and profile. This will be used by IMS system for subsequent data collections.
Remote Control: Select this option if you need to initiate the remote control of systems. You can remotely access this system only if you have installed VNC (Virtual Network Computing) and then configured SapphireIMS for remote access. For more information please refer the related topic section at the end of this page.
Associated Records: Select this if you want to see the records associated with this server. This window allows to select the 'From' and 'To' time period for viewing the records.
New Notification Profile: Select this option to add a new notification profile. For more information please refer to the topic Defining Notifications.
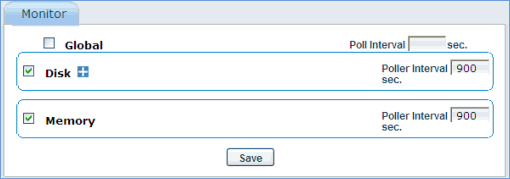
Monitor: Select this if the poller interval needs to be changed. Default is 15 min/300 sec.
If the poller interval needs to be changed for all the parameters then select the ‘Global’ option and enter the time in the 'Poll Interval' box.
If you need to change the time interval individually then select the parameter and enter the number of seconds in the text box next to poller interval.
Click on the "Save" button.
Inventory View: Select this option if you need inventory information of the server. This screen will display the hardware, software and resource related information. Refer to Inventory->Summary for more details.
Ping: Click this to open the Ping configuration screen for the server
Traceroute: Click this to open the Traceroute configuration screen for the server
SNMP Walk: Click this to open the SNMP Walk configuration screen for the server
'Dashboard' tab displays the graphical representation of data collected from servers configured for performance monitoring in various charts.
To configure servers for performance monitoring, go to 'Settings > Business Service Monitoring > System Performance'
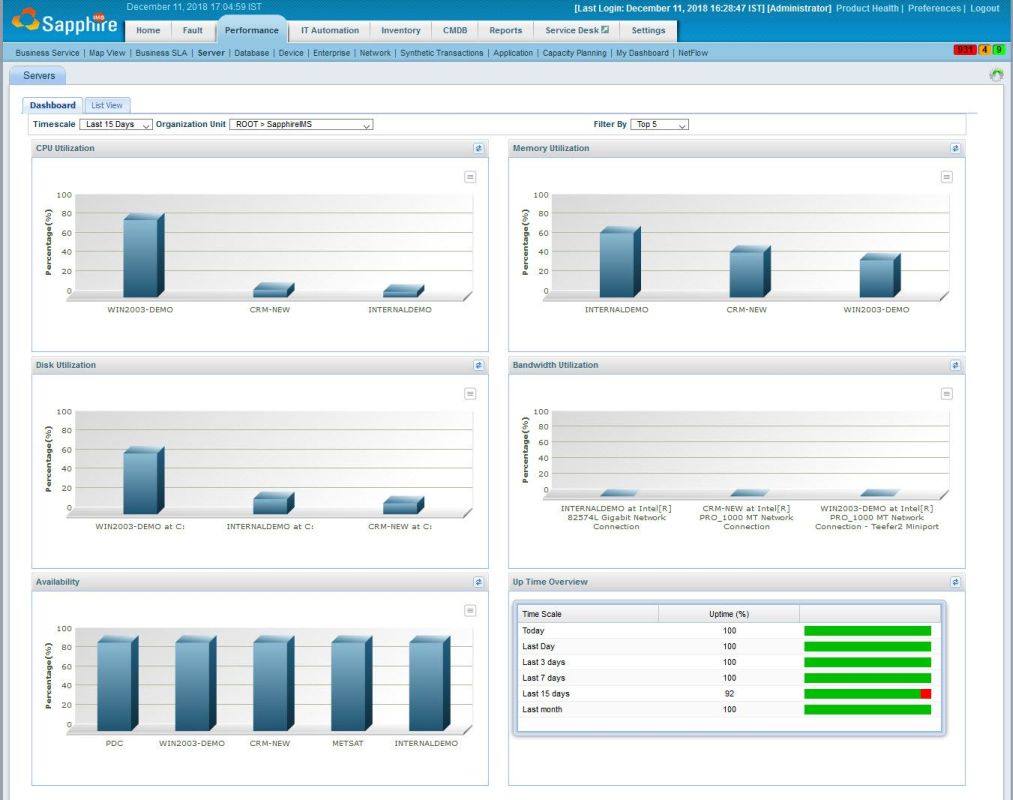
Select the 'Timescale' filter which can be a fixed period or a custom time where you can specify the From and To dates.
Select the 'Organization Unit' to filter data only for a specific OU.
Select the 'Filter by' to get the dashboard view for one of either Top 2, 5 or 10 or Bottom 2,5 or 10 servers.
The individual dashboards display the CPU, Memory, Disk and Network Interface Bandwidth Utilization and the Availability.
Individually click any chart to display in a pop-up window.
Scroll down to display the 'System Up Time' chart which gives the percentage of systems that are up and running in the specified period.
Clicking on any of the servers in the charts opens up a screen with detailed data about the server (see Server Detailed View below)